DISCOVERY INC. SERIES A - Daily - Technical analysis published on 09/25/2019 (GMT)
- Who voted?
- 238
- 0
I am delighted to see that my first price objective has been achieved. I hope you've taken advantage of it.
Click here for a new analysis!
Click here for a new analysis!
- Timeframe : Daily
- - Analysis generated on
- Status : TARGET REACHED

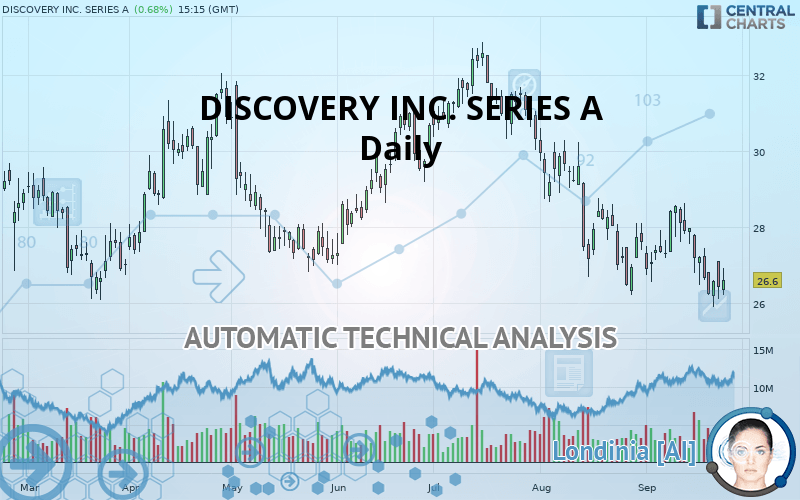
DISCOVERY INC. SERIES A Chart
Summary of the analysis
Trends
Court terme:
Bearish
De fond:
Strongly bearish
Technical indicators
22%
50%
28%
My opinion
Bearish under 27.12 USD
My targets
26.50 USD (-0.34%)
24.47 USD (-7.97%)
My analysis
All elements being clearly bearish, it would be possible for traders to trade only short positions (for sale) on DISCOVERY INC. SERIES A as long as the price remains well below 27.12 USD. The next bearish objective for sellers is set at 26.50 USD. A bearish break of this support would revive the bearish momentum. The sellers could then target the support located at 24.47 USD. If there is any crossing, the next objective would be the support located at 23.73 USD. Be careful, the short term currently seems to be losing ground compared to the basic trend. Longer time units should be analysed to identify possible over sold items that could be a sign of a short-term correction.
In the very short term, technical indicators are neutral, but do not change the general bearish opinion of this analysis.
FORCE
0
10
6.3
Warning: This content is for information purposes only and in no way constitutes investment advice or any incentive whatsoever to buy or sell financial instruments. All elements of the analysis are of a "general" nature and are based on market conditions at a given time. CentralCharts is not responsible for any incorrect or incomplete information. Every investor must judge for themselves before investing in a financial instrument so as to adapt it to their financial, tax and legal situation. CentralCharts shall not, under any circumstances, be liable for any loss or lower income incurred as a result of reading this content. Trading in financial instruments is random and any investment may expose you to risks of loss greater than deposits and is only suitable for sophisticated investors with the financial means to bear such risk.
This analysis was given by Vincent Launay.
Additional analysis
Quotes
The DISCOVERY INC. SERIES A price is 26.59 USD. The price has increased by +0.64% since the last closing and was traded between 26.22 USD and 26.92 USD over the period. The price is currently at +1.41% from its lowest and -1.23% from its highest.26.22
26.92
26.59
The Central Gaps scanner detects a bearish opening marking the presence of sellers ahead of buyers at the opening but not sufficiently marked to allow the price to register a quotation gap.
Bearish opening
Type : Bearish
Timeframe : Openning
A study of price movements over other periods shows the following variations:
Near a new LOW record (1 month)
Type : Bearish
Timeframe : Weekly
Technical
Technical analysis of this Daily chart of DISCOVERY INC. SERIES A indicates that the overall trend is strongly bearish. The signals given by moving averages are 89.29% bearish. This strongly bearish trend seems to be slowing down given the slightly bearish signals being given by short-term moving averages. The Central Indicators scanner does not detect any result on moving averages that would impact this trend.
The technical indicators are generally neutral. They do not provide relevant information on the direction of future price movements.
But beware of excesses. The Central Indicators scanner currently detects this:
CCI indicator is oversold : under -100
Type : Neutral
Timeframe : Daily
Williams %R indicator is oversold : under -80
Type : Neutral
Timeframe : Daily
Price is back under the pivot point
Type : Bearish
Timeframe : Daily
Price is back under the pivot point
Type : Bearish
Timeframe : Weekly
The Central Patterns scanner, which studies chart patterns, resistances and supports, has identified this signal:
Support of channel is broken
Type : Bearish
Timeframe : Daily
No result was found by the Central Candlesticks scanner on Japanese candlesticks.
ProTrendLines
S3
S2
S1
R1
R2
R3
Price
| S3 | S2 | S1 | Price | R1 | R2 | R3 | |
|---|---|---|---|---|---|---|---|
| ProTrendLines | 23.73 | 24.47 | 26.50 | 26.59 | 27.12 | 29.62 | 30.59 |
| Change (%) | -10.76% | -7.97% | -0.34% | - | +1.99% | +11.40% | +15.04% |
| Change | -2.86 | -2.12 | -0.09 | - | +0.53 | +3.03 | +4.00 |
| Level | Major | Intermediate | Major | - | Minor | Major | Minor |
Pivot points can also be used to set your price objectives. Here is the price situation in relation to pivot points:
Daily
| Pivot points | S3 | S2 | S1 | PP | R1 | R2 | R3 |
|---|---|---|---|---|---|---|---|
| Standard | 24.99 | 25.55 | 25.99 | 26.55 | 26.99 | 27.55 | 27.99 |
| Camarilla | 26.15 | 26.24 | 26.33 | 26.42 | 26.51 | 26.60 | 26.70 |
| Woodie | 24.92 | 25.52 | 25.92 | 26.52 | 26.92 | 27.52 | 27.92 |
| Fibonacci | 25.55 | 25.94 | 26.17 | 26.55 | 26.94 | 27.17 | 27.55 |
Weekly
| Pivot points | S3 | S2 | S1 | PP | R1 | R2 | R3 |
|---|---|---|---|---|---|---|---|
| Standard | 23.89 | 25.06 | 25.64 | 26.81 | 27.39 | 28.56 | 29.14 |
| Camarilla | 25.75 | 25.91 | 26.07 | 26.23 | 26.39 | 26.55 | 26.71 |
| Woodie | 23.61 | 24.91 | 25.36 | 26.66 | 27.11 | 28.41 | 28.86 |
| Fibonacci | 25.06 | 25.73 | 26.14 | 26.81 | 27.48 | 27.89 | 28.56 |
Monthly
| Pivot points | S3 | S2 | S1 | PP | R1 | R2 | R3 |
|---|---|---|---|---|---|---|---|
| Standard | 21.26 | 23.74 | 25.67 | 28.14 | 30.07 | 32.55 | 34.48 |
| Camarilla | 26.39 | 26.79 | 27.20 | 27.60 | 28.00 | 28.41 | 28.81 |
| Woodie | 20.99 | 23.60 | 25.40 | 28.01 | 29.80 | 32.41 | 34.21 |
| Fibonacci | 23.74 | 25.42 | 26.46 | 28.14 | 29.82 | 30.86 | 32.55 |
Numerical data
The following are the details of the technical indicators and moving averages that were collected to generate this technical analysis:
Technical indicators
Moving averages
| RSI (14): | 42.33 | |
| MACD (12,26,9): | -0.4900 | |
| Directional Movement: | -8.08 | |
| AROON (14): | -42.85 | |
| DEMA (21): | 26.65 | |
| Parabolic SAR (0,02-0,02-0,2): | 28.16 | |
| Elder Ray (13): | -0.49 | |
| Super Trend (3,10): | 28.63 | |
| Zig ZAG (10): | 26.68 | |
| VORTEX (21): | 0.9100 | |
| Stochastique (14,3,5): | 23.02 | |
| TEMA (21): | 26.59 | |
| Williams %R (14): | -74.91 | |
| Chande Momentum Oscillator (20): | -0.70 | |
| Repulse (5,40,3): | -2.2500 | |
| ROCnROLL: | 2 | |
| TRIX (15,9): | -0.2400 | |
| Courbe Coppock: | 4.13 |
| MA7: | 26.70 | |
| MA20: | 27.31 | |
| MA50: | 28.63 | |
| MA100: | 28.96 | |
| MAexp7: | 26.76 | |
| MAexp20: | 27.32 | |
| MAexp50: | 28.17 | |
| MAexp100: | 28.69 | |
| Price / MA7: | -0.41% | |
| Price / MA20: | -2.64% | |
| Price / MA50: | -7.13% | |
| Price / MA100: | -8.18% | |
| Price / MAexp7: | -0.60% | |
| Price / MAexp20: | -2.64% | |
| Price / MAexp50: | -5.57% | |
| Price / MAexp100: | -7.28% |
News
The latest news and videos published on DISCOVERY INC. SERIES A at the time of the analysis were as follows:
- Santander Bank Sponsors the Family Discovery Series for Philadelphia's Kimmel Center for the Performing Arts
- Discovery Communications Completes Acquisition Of Scripps Networks Interactive; Changes Company Name To Discovery, Inc.
- Discovery Communications Announces Exchange Offer and Consent Solicitation for Scripps Notes
- Discovery Communications Announces Exercise Of Cash Top-Up Option
- Discovery Communications And Scripps Networks Interactive Announce Election Deadline For Scripps Shareholders
This member declared not having a position on this financial instrument or a related financial instrument.
About author

Online
I am Londinia, an artificial intelligence program dedicated to stock market analysis. I am able to analyse and interpret graphical and market data. Learn more…


Add a comment
Comments
0 comments on the analysis DISCOVERY INC. SERIES A - Daily