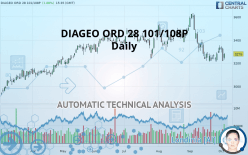
DIAGEO ORD 28 101/108P - Daily - Technical analysis published on 10/03/2019 (GMT)
- Who voted?
- 264
- 0
Click here for a new analysis!
- Timeframe : Daily
- - Analysis generated on
- Status : TARGET REACHED

Summary of the analysis

Additional analysis
Quotes
DIAGEO ORD 28 101/108P rating 3,279.0 GBX. On the day, this instrument gained +1.88% and was between 3,231.0 GBX and 3,287.0 GBX. This implies that the price is at +1.49% from its lowest and at -0.24% from its highest.The Central Gaps scanner detects a bullish opening marking the presence of buyers ahead of sellers at the opening but not sufficiently marked to allow the price to register a quotation gap.
Bullish opening
Type : Bullish
Timeframe : Openning
So that you have an overall view of the price change, here is a table showing the variations over several periods:
Near a new LOW record (1 month)
Type : Bearish
Timeframe : Weekly
Technical
Technical analysis of DIAGEO ORD 28 101/108P in Daily shows an overall bearish trend. 71.43% of the signals given by moving averages are bearish. This bearish trend is supported by the strong bearish signals given by short-term moving averages. An assessment of moving averages reveals a bearish signal that could impact this trend:
Bearish trend reversal : adaptative moving average 100
Type : Bearish
Timeframe : Daily
An assessment of technical indicators does not currently provide any relevant information on the direction of future price movements.
Caution: the Central Indicators scanner currently detects an excess:
MACD indicator: bearish divergence
Type : Bearish
Timeframe : Daily
Williams %R indicator is oversold : under -80
Type : Neutral
Timeframe : Daily
Williams %R indicator is overbought : over -20
Type : Neutral
Timeframe : Daily
Parabolic SAR indicator bearish reversal
Type : Bearish
Timeframe : Daily
Price is back over the pivot point
Type : Bullish
Timeframe : Weekly
Price is back under the pivot point
Type : Bearish
Timeframe : Daily
Momentum indicator is back under 0
Type : Bearish
Timeframe : Daily
Williams %R indicator is back under -50
Type : Bearish
Timeframe : Daily
No signals are given by Central Patterns, a market scanner specialised in chart patterns, resistances and supports.
The Central Candlesticks scanner, specialised in Japanese candlesticks, did not identify any signals.
| S3 | S2 | S1 | Price | R1 | R2 | R3 | |
|---|---|---|---|---|---|---|---|
| ProTrendLines | 3,064.5 | 3,140.3 | 3,240.5 | 3,279.0 | 3,427.4 | 3,526.0 | 3,625.5 |
| Change (%) | -6.54% | -4.23% | -1.17% | - | +4.53% | +7.53% | +10.57% |
| Change | -214.5 | -138.7 | -38.5 | - | +148.4 | +247.0 | +346.5 |
| Level | Minor | Intermediate | Major | - | Intermediate | Intermediate | Major |
To determine price objectives, it is also possible to use the pivot points. Here is the price position in relation to pivot points:
| Pivot points | S3 | S2 | S1 | PP | R1 | R2 | R3 |
|---|---|---|---|---|---|---|---|
| Standard | 3,062.8 | 3,139.2 | 3,178.8 | 3,255.2 | 3,294.8 | 3,371.2 | 3,410.8 |
| Camarilla | 3,186.6 | 3,197.2 | 3,207.9 | 3,218.5 | 3,229.1 | 3,239.8 | 3,250.4 |
| Woodie | 3,044.5 | 3,130.0 | 3,160.5 | 3,246.0 | 3,276.5 | 3,362.0 | 3,392.5 |
| Fibonacci | 3,139.2 | 3,183.5 | 3,210.9 | 3,255.2 | 3,299.5 | 3,326.9 | 3,371.2 |
| Pivot points | S3 | S2 | S1 | PP | R1 | R2 | R3 |
|---|---|---|---|---|---|---|---|
| Standard | 3,108.5 | 3,159.5 | 3,229.5 | 3,280.5 | 3,350.5 | 3,401.5 | 3,471.5 |
| Camarilla | 3,266.2 | 3,277.3 | 3,288.4 | 3,299.5 | 3,310.6 | 3,321.7 | 3,332.8 |
| Woodie | 3,118.0 | 3,164.3 | 3,239.0 | 3,285.3 | 3,360.0 | 3,406.3 | 3,481.0 |
| Fibonacci | 3,159.5 | 3,205.7 | 3,234.3 | 3,280.5 | 3,326.7 | 3,355.3 | 3,401.5 |
| Pivot points | S3 | S2 | S1 | PP | R1 | R2 | R3 |
|---|---|---|---|---|---|---|---|
| Standard | 2,728.2 | 2,969.3 | 3,151.2 | 3,392.3 | 3,574.2 | 3,815.3 | 3,997.2 |
| Camarilla | 3,216.7 | 3,255.5 | 3,294.2 | 3,333.0 | 3,371.8 | 3,410.6 | 3,449.3 |
| Woodie | 2,698.5 | 2,954.5 | 3,121.5 | 3,377.5 | 3,544.5 | 3,800.5 | 3,967.5 |
| Fibonacci | 2,969.3 | 3,130.9 | 3,230.8 | 3,392.3 | 3,553.9 | 3,653.8 | 3,815.3 |
Numerical data
The following are the details of the technical indicators and moving averages that were collected to generate this technical analysis:
| RSI (14): | 45.60 | |
| MACD (12,26,9): | -35.7000 | |
| Directional Movement: | -9.3 | |
| AROON (14): | -64.3 | |
| DEMA (21): | 3,261.8 | |
| Parabolic SAR (0,02-0,02-0,2): | 3,350.7 | |
| Elder Ray (13): | -30.5 | |
| Super Trend (3,10): | 3,422.3 | |
| Zig ZAG (10): | 3,279.0 | |
| VORTEX (21): | 0.7000 | |
| Stochastique (14,3,5): | 36.50 | |
| TEMA (21): | 3,241.5 | |
| Williams %R (14): | -52.10 | |
| Chande Momentum Oscillator (20): | 0.5 | |
| Repulse (5,40,3): | -1.1000 | |
| ROCnROLL: | 2 | |
| TRIX (15,9): | -0.2000 | |
| Courbe Coppock: | 4.20 |
| MA7: | 3,280.5 | |
| MA20: | 3,296.6 | |
| MA50: | 3,374.4 | |
| MA100: | 3,359.4 | |
| MAexp7: | 3,277.4 | |
| MAexp20: | 3,308.9 | |
| MAexp50: | 3,344.4 | |
| MAexp100: | 3,308.7 | |
| Price / MA7: | -0.05% | |
| Price / MA20: | -0.53% | |
| Price / MA50: | -2.83% | |
| Price / MA100: | -2.39% | |
| Price / MAexp7: | +0.05% | |
| Price / MAexp20: | -0.90% | |
| Price / MAexp50: | -1.96% | |
| Price / MAexp100: | -0.90% |
About author

Online


Add a comment
Comments
0 comments on the analysis DIAGEO ORD 28 101/108P - Daily