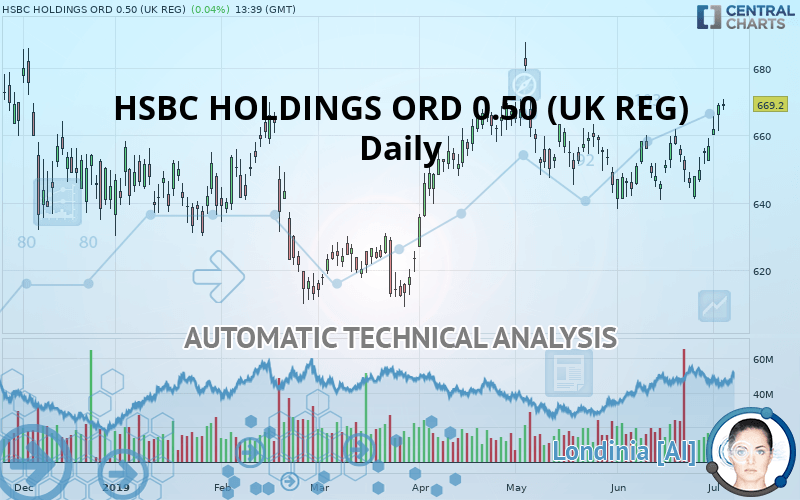
HSBC HOLDINGS ORD USD 0.50 (UK REG) - Daily - Technical analysis published on 07/03/2019 (GMT)
- Who voted?
- 311
- 0
Click here for a new analysis!
- Timeframe : Daily
- - Analysis generated on
- Status : TARGET REACHED

Summary of the analysis

Additional analysis
Quotes
HSBC HOLDINGS ORD 0.50 (UK REG) rating 669.2 GBX. On the day, this instrument gained +0.05% with the lowest point at 667.4 GBX and the highest point at 670.8 GBX. The deviation from the price is +0.27% for the low point and -0.24% for the high point.A bearish opening was detected by the Central Gaps scanner. Sellers are trying to impose a bearish trend in the very short term.
Bearish opening
Type : Bearish
Timeframe : Openning
So that you have an overall view of the price change, here is a table showing the variations over several periods:
Near a new HIGH record (1st january)
Type : Bullish
Timeframe : Weekly
Near a new LOW record (1 month)
Type : Bearish
Timeframe : Weekly
Technical
A technical analysis in Daily of this HSBC HOLDINGS ORD 0.50 (UK REG) chart shows a strongly bullish trend. 89.29% of the signals given by moving averages are bullish. This strongly bullish trend is supported by the strong bullish signals given by short-term moving averages. The Central Indicators market scanner currently does not detect any result that concerns moving averages.
In fact, 13 technical indicators on 18 studied are currently positioned bullish. Caution: the Central Indicators scanner currently detects an excess:
CCI indicator is overbought : over 100
Type : Neutral
Timeframe : Daily
Williams %R indicator is overbought : over -20
Type : Neutral
Timeframe : Daily
Pivot points : price is over resistance 1
Type : Neutral
Timeframe : Weekly
SuperTrend indicator bullish reversal
Type : Bullish
Timeframe : Daily
Price is back over the pivot point
Type : Bullish
Timeframe : Daily
The Central Patterns scanner, which studies chart patterns, resistances and supports, has identified these signals:
Near horizontal resistance
Type : Bearish
Timeframe : Daily
Near resistance of triangle
Type : Bearish
Timeframe : Daily
Resistance of channel is broken
Type : Bullish
Timeframe : Daily
No result was found by the Central Candlesticks scanner on Japanese candlesticks.
| S3 | S2 | S1 | Price | R1 | R2 | R3 | |
|---|---|---|---|---|---|---|---|
| ProTrendLines | 630.7 | 644.1 | 661.2 | 669.2 | 673.8 | 680.2 | 710.1 |
| Change (%) | -5.75% | -3.75% | -1.20% | - | +0.69% | +1.64% | +6.11% |
| Change | -38.5 | -25.1 | -8.0 | - | +4.6 | +11.0 | +40.9 |
| Level | Minor | Minor | Major | - | Minor | Major | Minor |
Attention could also be paid to pivot points to set price objectives:
| Pivot points | S3 | S2 | S1 | PP | R1 | R2 | R3 |
|---|---|---|---|---|---|---|---|
| Standard | 655.2 | 658.2 | 663.6 | 666.6 | 672.0 | 675.0 | 680.4 |
| Camarilla | 666.6 | 667.4 | 668.1 | 668.9 | 669.7 | 670.4 | 671.2 |
| Woodie | 656.3 | 658.8 | 664.7 | 667.2 | 673.1 | 675.6 | 681.5 |
| Fibonacci | 658.2 | 661.4 | 663.4 | 666.6 | 669.8 | 671.8 | 675.0 |
| Pivot points | S3 | S2 | S1 | PP | R1 | R2 | R3 |
|---|---|---|---|---|---|---|---|
| Standard | 627.5 | 634.2 | 645.6 | 652.3 | 663.7 | 670.4 | 681.8 |
| Camarilla | 651.9 | 653.6 | 655.2 | 656.9 | 658.6 | 660.2 | 661.9 |
| Woodie | 629.8 | 635.4 | 647.8 | 653.5 | 666.0 | 671.6 | 684.0 |
| Fibonacci | 634.2 | 641.1 | 645.4 | 652.3 | 659.2 | 663.5 | 670.4 |
Numerical data
The following are the details of the technical indicators and moving averages that were collected to generate this technical analysis:
| RSI (14): | 65.50 | |
| MACD (12,26,9): | 3.2000 | |
| Directional Movement: | 13.3 | |
| AROON (14): | 92.9 | |
| DEMA (21): | 659.1 | |
| Parabolic SAR (0,02-0,02-0,2): | 642.6 | |
| Elder Ray (13): | 11.5 | |
| Super Trend (3,10): | 648.4 | |
| Zig ZAG (10): | 669.1 | |
| VORTEX (21): | 1.1000 | |
| Stochastique (14,3,5): | 91.70 | |
| TEMA (21): | 661.0 | |
| Williams %R (14): | -6.00 | |
| Chande Momentum Oscillator (20): | 17.9 | |
| Repulse (5,40,3): | 1.0000 | |
| ROCnROLL: | 1 | |
| TRIX (15,9): | 0.0000 | |
| Courbe Coppock: | 2.60 |
| MA7: | 658.4 | |
| MA20: | 653.8 | |
| MA50: | 654.0 | |
| MA100: | 639.6 | |
| MAexp7: | 661.0 | |
| MAexp20: | 655.7 | |
| MAexp50: | 650.9 | |
| MAexp100: | 644.3 | |
| Price / MA7: | +1.64% | |
| Price / MA20: | +2.36% | |
| Price / MA50: | +2.32% | |
| Price / MA100: | +4.63% | |
| Price / MAexp7: | +1.24% | |
| Price / MAexp20: | +2.06% | |
| Price / MAexp50: | +2.81% | |
| Price / MAexp100: | +3.86% |
News
Don"t forget to follow the news on HSBC HOLDINGS ORD 0.50 (UK REG). At the time of publication of this analysis, the latest news was as follows:
- HSBC BANK PLC - Form 8.5 (EPT/RI) - BCA Marketplace plc
- HSBC BANK PLC - Form 8.5 (EPT/RI) - BCA Marketplace plc
- Form 8.5 (EPT/RI) - HSBC BANK PLC - BCA Marketplace Plc
- Form 8.5 (EPT/RI) - HSBC BANK PLC - BCA Marketplace Plc
- Form 8.5 (EPT/RI) - HSBC Bank Plc - BCA Marketplace plc
About author

Online


Add a comment
Comments
0 comments on the analysis HSBC HOLDINGS ORD USD 0.50 (UK REG) - Daily