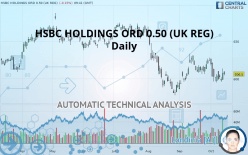
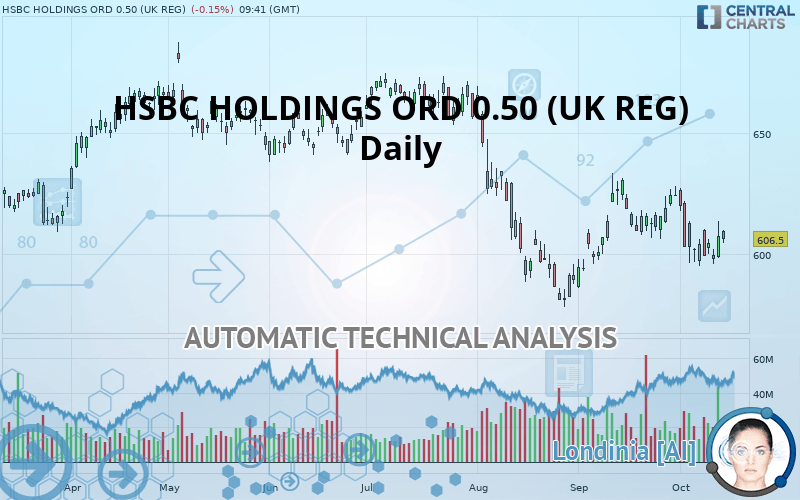
HSBC HOLDINGS ORD USD 0.50 (UK REG) - Daily - Technical analysis published on 10/14/2019 (GMT)
- Who voted?
- 347
- 0
- Timeframe : Daily
- - Analysis generated on
- Status : NEUTRAL
Summary of the analysis

Additional analysis
Quotes
The HSBC HOLDINGS ORD 0.50 (UK REG) rating is 606.6 GBX. The price is lower by -0.13% since the last closing and was traded between 604.6 GBX and 610.2 GBX over the period. The price is currently at +0.33% from its lowest and -0.59% from its highest.The Central Gaps scanner detects a bullish opening. A small advantage for buyers in the very short term.
Bullish opening
Type : Bullish
Timeframe : Openning
Here is a more detailed summary of the historical variations registered by HSBC HOLDINGS ORD 0.50 (UK REG):
Technical
A technical analysis in Daily of this HSBC HOLDINGS ORD 0.50 (UK REG) chart shows a slightly bearish trend. 57.14% of the signals given by moving averages are bearish. Caution: the slightly bullish signals currently being given by short-term moving averages indicate that this overall trend could be reversed. The Central Indicators market scanner is currently detecting several bullish signals that could impact this trend:
Bullish trend reversal : adaptative moving average 20
Type : Bullish
Timeframe : Daily
Bullish trend reversal : adaptative moving average 50
Type : Bullish
Timeframe : Daily
Bullish price crossover with Moving Average 20
Type : Bullish
Timeframe : Daily
Bullish price crossover with Moving Average 50
Type : Bullish
Timeframe : Daily
Bullish price crossover with adaptative moving average 20
Type : Bullish
Timeframe : Daily
Bullish price crossover with adaptative moving average 50
Type : Bullish
Timeframe : Daily
In fact, only 9 technical indicators out of 18 studied are currently bullish. Caution: the Central Indicators scanner currently detects an excess:
Williams %R indicator is overbought : over -20
Type : Neutral
Timeframe : Daily
RSI indicator is back over 50
Type : Bullish
Timeframe : Daily
Parabolic SAR indicator bullish reversal
Type : Bullish
Timeframe : Daily
Price is back over the pivot point
Type : Bullish
Timeframe : Daily
Price is back over the pivot point
Type : Bullish
Timeframe : Weekly
Williams %R indicator is back over -50
Type : Bullish
Timeframe : Daily
The analysis of the price chart with Central Patterns scanners does not return any result.
The Central Candlesticks scanner, specialised in Japanese candlesticks, did not identify any signals.
| S3 | S2 | S1 | Price | R1 | R2 | R3 | |
|---|---|---|---|---|---|---|---|
| ProTrendLines | 580.9 | 591.3 | 599.6 | 606.6 | 612.6 | 644.3 | 661.2 |
| Change (%) | -4.24% | -2.52% | -1.15% | - | +0.99% | +6.21% | +9.00% |
| Change | -25.7 | -15.3 | -7.0 | - | +6.0 | +37.7 | +54.6 |
| Level | Major | Minor | Major | - | Major | Intermediate | Major |
To determine price objectives, it is also possible to use the pivot points. Here is the price position in relation to pivot points:
| Pivot points | S3 | S2 | S1 | PP | R1 | R2 | R3 |
|---|---|---|---|---|---|---|---|
| Standard | 584.1 | 591.3 | 599.4 | 606.6 | 614.7 | 621.9 | 630.0 |
| Camarilla | 603.2 | 604.6 | 606.0 | 607.4 | 608.8 | 610.2 | 611.6 |
| Woodie | 584.5 | 591.5 | 599.8 | 606.8 | 615.1 | 622.1 | 630.4 |
| Fibonacci | 591.3 | 597.2 | 600.8 | 606.6 | 612.5 | 616.1 | 621.9 |
| Pivot points | S3 | S2 | S1 | PP | R1 | R2 | R3 |
|---|---|---|---|---|---|---|---|
| Standard | 570.6 | 578.8 | 589.0 | 597.3 | 607.5 | 615.7 | 625.9 |
| Camarilla | 594.1 | 595.8 | 597.5 | 599.2 | 600.9 | 602.5 | 604.2 |
| Woodie | 571.5 | 579.3 | 589.9 | 597.8 | 608.4 | 616.2 | 626.8 |
| Fibonacci | 578.8 | 585.9 | 590.2 | 597.3 | 604.3 | 608.7 | 615.7 |
| Pivot points | S3 | S2 | S1 | PP | R1 | R2 | R3 |
|---|---|---|---|---|---|---|---|
| Standard | 541.1 | 559.6 | 587.9 | 606.4 | 634.6 | 653.2 | 681.4 |
| Camarilla | 603.3 | 607.6 | 611.8 | 616.1 | 620.4 | 624.7 | 629.0 |
| Woodie | 546.0 | 562.1 | 592.8 | 608.8 | 639.5 | 655.6 | 686.3 |
| Fibonacci | 559.6 | 577.5 | 588.5 | 606.4 | 624.3 | 635.3 | 653.2 |
Numerical data
The following is the status of the technical indicators and moving averages at the time of publication of this technical analysis:
| RSI (14): | 54.20 | |
| MACD (12,26,9): | -0.8000 | |
| Directional Movement: | 7.4 | |
| AROON (14): | -35.7 | |
| DEMA (21): | 601.1 | |
| Parabolic SAR (0,02-0,02-0,2): | 587.7 | |
| Elder Ray (13): | 5.6 | |
| Super Trend (3,10): | 624.9 | |
| Zig ZAG (10): | 606.9 | |
| VORTEX (21): | 0.9000 | |
| Stochastique (14,3,5): | 52.10 | |
| TEMA (21): | 602.1 | |
| Williams %R (14): | -38.80 | |
| Chande Momentum Oscillator (20): | -3.8 | |
| Repulse (5,40,3): | 0.0000 | |
| ROCnROLL: | -1 | |
| TRIX (15,9): | 0.0000 | |
| Courbe Coppock: | 2.50 |
| MA7: | 598.5 | |
| MA20: | 603.4 | |
| MA50: | 598.9 | |
| MA100: | 619.5 | |
| MAexp7: | 601.7 | |
| MAexp20: | 602.1 | |
| MAexp50: | 606.0 | |
| MAexp100: | 611.9 | |
| Price / MA7: | +1.35% | |
| Price / MA20: | +0.53% | |
| Price / MA50: | +1.29% | |
| Price / MA100: | -2.08% | |
| Price / MAexp7: | +0.80% | |
| Price / MAexp20: | +0.73% | |
| Price / MAexp50: | +0.08% | |
| Price / MAexp100: | -0.88% |
News
Don"t forget to follow the news on HSBC HOLDINGS ORD 0.50 (UK REG). At the time of publication of this analysis, the latest news was as follows:
- The HongKong and Shanghai Banking Corporation Limited - Hong Kong Exchanges and Clearing Limited - Form 8.5 (EPT/NON-RI)
- The Hongkong and Shanghai Banking Corporation Limited Private Banking Division, Hong Kong - Hong Kong Stock Exchange & Clearing - Form 8 (DD)
- The Hongkong and Shanghai Banking Corporation Limited, Singapore Branch, Private Banking Division - Hong Kong Stock Exchange & Clearing - Form 8 (DD)
- HSBC BANK PLC - London Stock Exchange Group Plc - Form 8.5 (EPT/RI)
- HSBC BANK PLC - BCA Marketplace Plc - Form 8.5 (EPT/RI)
About author

Online


Add a comment
Comments
0 comments on the analysis HSBC HOLDINGS ORD USD 0.50 (UK REG) - Daily