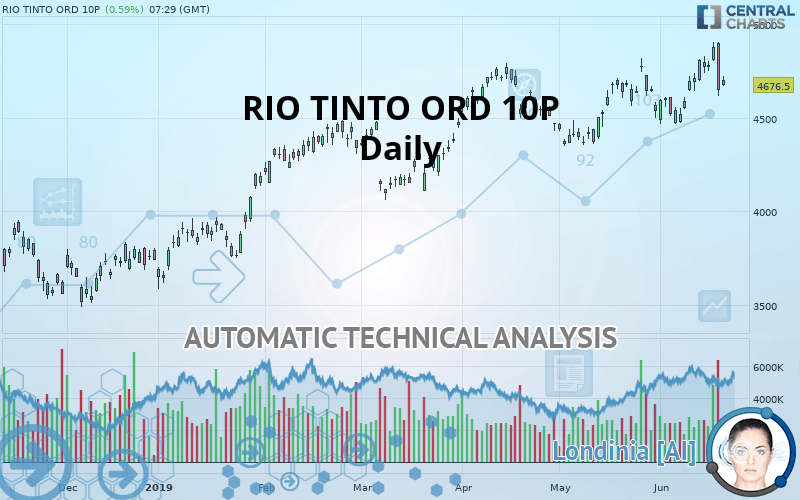
RIO TINTO ORD 10P - Daily - Technical analysis published on 06/20/2019 (GMT)
- Who voted?
- 235
- 0
Click here for a new analysis!
- Timeframe : Daily
- - Analysis generated on
- Status : TARGET REACHED

Summary of the analysis

Additional analysis
Quotes
The RIO TINTO ORD 10P price is 4,676.5 GBX. The price registered an increase of +0.59% on the session and was between 4,666.5 GBX and 4,721.5 GBX. This implies that the price is at +0.21% from its lowest and at -0.95% from its highest.The Central Gaps scanner detects a bullish opening marking the presence of buyers ahead of sellers at the opening but not sufficiently marked to allow the price to register a quotation gap.
Bullish opening
Type : Bullish
Timeframe : Openning
So that you have an overall view of the price change, here is a table showing the variations over several periods:
New HIGH record (5 years)
Type : Bullish
Timeframe : Weekly
Near a new HIGH record (1st january)
Type : Bullish
Timeframe : Weekly
Technical
A technical analysis in Daily of this RIO TINTO ORD 10P chart shows a strongly bullish trend. 92.86% of the signals given by moving averages are bullish. This strongly bullish trend is supported by the strong bullish signals given by short-term moving averages. The Central Indicators market scanner is currently detecting a bearish signal that could impact this trend:
Bearish price crossover with Moving Average 20
Type : Bearish
Timeframe : Daily
An assessment of technical indicators shows a slightly bullish signal.
Caution: the Central Indicators scanner currently detects an excess:
Previous candle closed over Bollinger bands
Type : Neutral
Timeframe : Daily
Price is back over the pivot point
Type : Bullish
Timeframe : Weekly
Price is back under the pivot point
Type : Bearish
Timeframe : Daily
Williams %R indicator is back under -50
Type : Bearish
Timeframe : Daily
The Central Patterns scanner, which studies chart patterns, resistances and supports, has identified this signal:
Horizontal support is broken
Type : Bearish
Timeframe : Daily
The presence of these bearish patterns in Japanese candlesticks detected by Central Candlesticks that could cause a correction in the very short term were also noted
Long black line
Type : Bearish
Timeframe : Daily
Bearish engulfing lines
Type : Bearish
Timeframe : Daily
| S3 | S2 | S1 | Price | R1 | |
|---|---|---|---|---|---|
| ProTrendLines | 4,120.0 | 4,518.5 | 4,636.2 | 4,676.5 | 4,773.8 |
| Change (%) | -11.90% | -3.38% | -0.86% | - | +2.08% |
| Change | -556.5 | -158.0 | -40.3 | - | +97.3 |
| Level | Intermediate | Major | Major | - | Major |
To determine price objectives, it is also possible to use the pivot points. Here is the price position in relation to pivot points:
| Pivot points | S3 | S2 | S1 | PP | R1 | R2 | R3 |
|---|---|---|---|---|---|---|---|
| Standard | 4,254.7 | 4,435.3 | 4,542.2 | 4,722.8 | 4,829.7 | 5,010.3 | 5,117.2 |
| Camarilla | 4,569.9 | 4,596.3 | 4,622.6 | 4,649.0 | 4,675.4 | 4,701.7 | 4,728.1 |
| Woodie | 4,217.8 | 4,416.9 | 4,505.2 | 4,704.4 | 4,792.8 | 4,991.9 | 5,080.2 |
| Fibonacci | 4,435.3 | 4,545.2 | 4,613.0 | 4,722.8 | 4,832.7 | 4,900.5 | 5,010.3 |
| Pivot points | S3 | S2 | S1 | PP | R1 | R2 | R3 |
|---|---|---|---|---|---|---|---|
| Standard | 4,319.2 | 4,433.3 | 4,601.7 | 4,715.8 | 4,884.2 | 4,998.3 | 5,166.7 |
| Camarilla | 4,692.3 | 4,718.2 | 4,744.1 | 4,770.0 | 4,795.9 | 4,821.8 | 4,847.7 |
| Woodie | 4,346.2 | 4,446.9 | 4,628.8 | 4,729.4 | 4,911.2 | 5,011.9 | 5,193.8 |
| Fibonacci | 4,433.3 | 4,541.2 | 4,607.9 | 4,715.8 | 4,823.7 | 4,890.4 | 4,998.3 |
Numerical data
The following is the status of technical indicators and moving averages registered at the time this technical analysis was created:
| RSI (14): | 51.90 | |
| MACD (12,26,9): | 50.2000 | |
| Directional Movement: | 0.2 | |
| AROON (14): | 78.6 | |
| DEMA (21): | 4,729.4 | |
| Parabolic SAR (0,02-0,02-0,2): | 4,582.6 | |
| Elder Ray (13): | 3.4 | |
| Super Trend (3,10): | 4,557.5 | |
| Zig ZAG (10): | 4,667.5 | |
| VORTEX (21): | 0.9000 | |
| Stochastique (14,3,5): | 60.90 | |
| TEMA (21): | 4,740.2 | |
| Williams %R (14): | -52.60 | |
| Chande Momentum Oscillator (20): | 65.0 | |
| Repulse (5,40,3): | -4.4000 | |
| ROCnROLL: | -1 | |
| TRIX (15,9): | 0.1000 | |
| Courbe Coppock: | 4.80 |
| MA7: | 4,757.2 | |
| MA20: | 4,658.9 | |
| MA50: | 4,602.3 | |
| MA100: | 4,376.8 | |
| MAexp7: | 4,725.6 | |
| MAexp20: | 4,667.1 | |
| MAexp50: | 4,563.9 | |
| MAexp100: | 4,370.5 | |
| Price / MA7: | -1.70% | |
| Price / MA20: | +0.38% | |
| Price / MA50: | +1.61% | |
| Price / MA100: | +6.85% | |
| Price / MAexp7: | -1.04% | |
| Price / MAexp20: | +0.20% | |
| Price / MAexp50: | +2.47% | |
| Price / MAexp100: | +7.00% |
About author

Online


Add a comment
Comments
0 comments on the analysis RIO TINTO ORD 10P - Daily