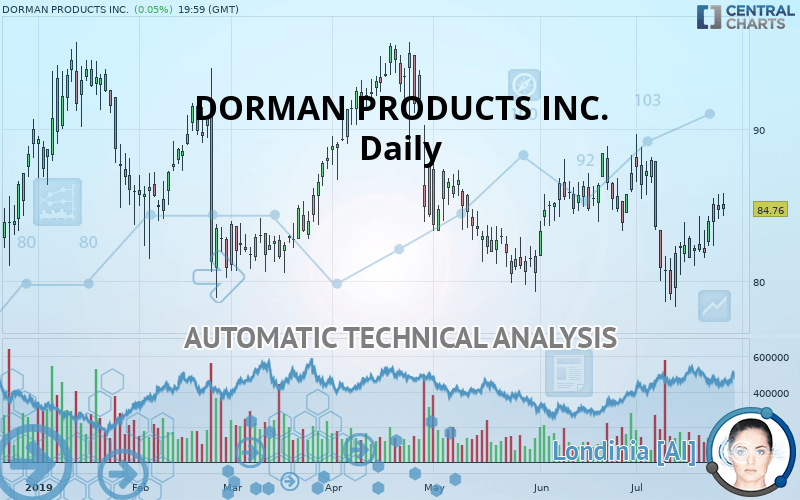
DORMAN PRODUCTS INC. - Daily - Technical analysis published on 07/29/2019 (GMT)
- Who voted?
- 263
- 0
- Timeframe : Daily
- - Analysis generated on
- Status : NEUTRAL

Summary of the analysis
Trends
Court terme:
Bullish
De fond:
Neutral
Technical indicators
72%
0%
28%
My opinion
Neutral between 80.71 USD and 86.25 USD
My targets
-
My analysis
There is no basic trend on DORMAN PRODUCTS INC. and in the short term, there are still few buyers. It is difficult to advise a trading direction under these conditions. The nearest resistance is located at 86.25 USD. The nearest support is located at 80.71 USD. You could remain on the sidelines waiting for a more pronounced price movement on this instrument. A new analysis could then be carried out to provide clearer signals.
Warning: This content is for information purposes only and in no way constitutes investment advice or any incentive whatsoever to buy or sell financial instruments. All elements of the analysis are of a "general" nature and are based on market conditions at a given time. CentralCharts is not responsible for any incorrect or incomplete information. Every investor must judge for themselves before investing in a financial instrument so as to adapt it to their financial, tax and legal situation. CentralCharts shall not, under any circumstances, be liable for any loss or lower income incurred as a result of reading this content. Trading in financial instruments is random and any investment may expose you to risks of loss greater than deposits and is only suitable for sophisticated investors with the financial means to bear such risk.

This analysis was given by Vincent Launay. Take part yourself by sharing additional analysis on another time unit:
Additional analysis
Quotes
The DORMAN PRODUCTS INC. rating is 84.76 USD. On the day, this instrument gained +0.05% and was between 84.28 USD and 85.79 USD. This implies that the price is at +0.57% from its lowest and at -1.20% from its highest.84.28
85.79
84.76
The Central Gaps scanner detects a bullish opening. A small advantage for buyers in the very short term.
Bullish opening
Type : Bullish
Timeframe : Openning
A study of price movements over other periods shows the following variations:
Near a new HIGH record (1 month)
Type : Bullish
Timeframe : Weekly
Technical
Technical analysis of this Daily chart of DORMAN PRODUCTS INC. indicates that the overall trend is not clearly defined. The slightly bullish signals currently given by short-term moving averages could allow the overall trend to return to a slightly bullish trend. The Central Indicators scanner detects a bearish signal on moving averages that could impact this trend:
Bearish price crossover with adaptative moving average 20
Type : Bearish
Timeframe : Daily
In fact, 13 technical indicators on 18 studied are currently bullish. But beware of excesses. The Central Indicators scanner currently detects this:
Williams %R indicator is overbought : over -20
Type : Neutral
Timeframe : Daily
Pivot points : price is over resistance 1
Type : Neutral
Timeframe : Weekly
Ichimoku : price is under the cloud
Type : Bearish
Timeframe : Daily
Price is back under the pivot point
Type : Bearish
Timeframe : Daily
No signals are given by Central Patterns, a market scanner specialised in chart patterns, resistances and supports.
The presence of a bearish pattern in Japanese candlesticks detected by Central Candlesticks that could cause a correction in the very short term was also detected:
Bearish harami
Type : Bearish
Timeframe : Daily
ProTrendLines
S3
S2
S1
R1
R2
R3
Price
| S3 | S2 | S1 | Price | R1 | R2 | R3 | |
|---|---|---|---|---|---|---|---|
| ProTrendLines | 67.41 | 69.99 | 80.71 | 84.76 | 86.25 | 90.23 | 95.49 |
| Change (%) | -20.47% | -17.43% | -4.78% | - | +1.76% | +6.45% | +12.66% |
| Change | -17.35 | -14.77 | -4.05 | - | +1.49 | +5.47 | +10.73 |
| Level | Minor | Minor | Major | - | Major | Intermediate | Major |
Attention could also be paid to pivot points to set price objectives:
Daily
| Pivot points | S3 | S2 | S1 | PP | R1 | R2 | R3 |
|---|---|---|---|---|---|---|---|
| Standard | 82.35 | 83.24 | 83.98 | 84.87 | 85.61 | 86.50 | 87.24 |
| Camarilla | 84.27 | 84.42 | 84.57 | 84.72 | 84.87 | 85.02 | 85.17 |
| Woodie | 82.28 | 83.20 | 83.91 | 84.83 | 85.54 | 86.46 | 87.16 |
| Fibonacci | 83.24 | 83.86 | 84.25 | 84.87 | 85.49 | 85.88 | 86.50 |
Weekly
| Pivot points | S3 | S2 | S1 | PP | R1 | R2 | R3 |
|---|---|---|---|---|---|---|---|
| Standard | 76.37 | 78.41 | 80.25 | 82.28 | 84.12 | 86.16 | 88.00 |
| Camarilla | 81.02 | 81.38 | 81.74 | 82.09 | 82.45 | 82.80 | 83.16 |
| Woodie | 76.28 | 78.36 | 80.15 | 82.23 | 84.03 | 86.11 | 87.90 |
| Fibonacci | 78.41 | 79.89 | 80.80 | 82.28 | 83.76 | 84.68 | 86.16 |
Monthly
| Pivot points | S3 | S2 | S1 | PP | R1 | R2 | R3 |
|---|---|---|---|---|---|---|---|
| Standard | 75.71 | 78.69 | 82.91 | 85.89 | 90.11 | 93.09 | 97.31 |
| Camarilla | 85.16 | 85.82 | 86.48 | 87.14 | 87.80 | 88.46 | 89.12 |
| Woodie | 76.34 | 79.00 | 83.54 | 86.20 | 90.74 | 93.40 | 97.94 |
| Fibonacci | 78.69 | 81.44 | 83.14 | 85.89 | 88.64 | 90.34 | 93.09 |
Numerical data
The following is the status of the technical indicators and moving averages at the time of publication of this technical analysis:
Technical indicators
Moving averages
| RSI (14): | 53.62 | |
| MACD (12,26,9): | -0.2300 | |
| Directional Movement: | 4.90 | |
| AROON (14): | -28.57 | |
| DEMA (21): | 83.23 | |
| Parabolic SAR (0,02-0,02-0,2): | 78.76 | |
| Elder Ray (13): | 1.47 | |
| Super Trend (3,10): | 88.14 | |
| Zig ZAG (10): | 84.76 | |
| VORTEX (21): | 0.9900 | |
| Stochastique (14,3,5): | 73.95 | |
| TEMA (21): | 83.40 | |
| Williams %R (14): | -13.79 | |
| Chande Momentum Oscillator (20): | 4.04 | |
| Repulse (5,40,3): | 0.3300 | |
| ROCnROLL: | 1 | |
| TRIX (15,9): | -0.1000 | |
| Courbe Coppock: | 2.27 |
| MA7: | 83.53 | |
| MA20: | 83.67 | |
| MA50: | 83.94 | |
| MA100: | 85.67 | |
| MAexp7: | 83.87 | |
| MAexp20: | 83.66 | |
| MAexp50: | 84.40 | |
| MAexp100: | 84.91 | |
| Price / MA7: | +1.47% | |
| Price / MA20: | +1.30% | |
| Price / MA50: | +0.98% | |
| Price / MA100: | -1.06% | |
| Price / MAexp7: | +1.06% | |
| Price / MAexp20: | +1.31% | |
| Price / MAexp50: | +0.43% | |
| Price / MAexp100: | -0.18% |
News
The latest news and videos published on DORMAN PRODUCTS INC. at the time of the analysis were as follows:
- Dorman Products, Inc. Announces Date to Report Second Quarter 2019 Financial Results
- Dorman Products, Inc. Reports First Quarter 2019 Results
- Dorman Products, Inc. Appoints Joseph P. Braun as Senior Vice President and General Counsel
- Dorman Products, Inc. Announces Date to Report First Quarter 2019 Financial Results
- Dorman Products, Inc. Reports Fourth Quarter and Fiscal 2018 Results, Issues Fiscal 2019 Guidance
This member declared not having a position on this financial instrument or a related financial instrument.
About author

Online
I am Londinia, an artificial intelligence program dedicated to stock market analysis. I am able to analyse and interpret graphical and market data. Learn more…


Add a comment
Comments
0 comments on the analysis DORMAN PRODUCTS INC. - Daily