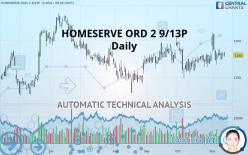
HOMESERVE ORD 2 9/13P - Daily - Technical analysis published on 11/13/2019 (GMT)
- Who voted?
- 182
- 0
Click here for a new analysis!
- Timeframe : Daily
- - Analysis generated on
- Status : TARGET REACHED

Summary of the analysis
Additional analysis
Quotes
HOMESERVE ORD 2 9/13P rating 1,160 GBX. The price has increased by +0.00% since the last closing and was between 1,155 GBX and 1,170 GBX. This implies that the price is at +0.43% from its lowest and at -0.85% from its highest.The Central Gaps scanner detects a bullish opening marking the presence of buyers ahead of sellers at the opening but not sufficiently marked to allow the price to register a quotation gap.
Bullish opening
Type : Bullish
Timeframe : Openning
So that you have an overall view of the price change, here is a table showing the variations over several periods:
Technical
A technical analysis in Daily of this HOMESERVE ORD 2 9/13P chart shows a strongly bullish trend. The signals given by the moving averages are 82.14% bullish. This strong bullish trend is confirmed by the strong signals currently being given by short-term moving averages. The Central Indicators market scanner is currently detecting several bullish signals that could impact this trend:
Moving Average bullish crossovers : MA20 & MA50
Type : Bullish
Timeframe : Daily
Bullish price crossover with Moving Average 20
Type : Bullish
Timeframe : Daily
Bullish price crossover with Moving Average 50
Type : Bullish
Timeframe : Daily
Bullish price crossover with adaptative moving average 20
Type : Bullish
Timeframe : Daily
Bullish price crossover with adaptative moving average 100
Type : Bullish
Timeframe : Daily
Technical indicators are slightly bullish. There is therefore considerable uncertainty about the continuation of the increase.
Central Indicators, the scanner specialised in technical indicators, has identified these signals:
RSI indicator is back over 50
Type : Bullish
Timeframe : Daily
Ichimoku : price is over the cloud
Type : Bullish
Timeframe : Daily
Price is back under the pivot point
Type : Bearish
Timeframe : Daily
Price is back under the pivot point
Type : Bearish
Timeframe : Weekly
The Central Patterns scanner, which studies chart patterns, resistances and supports, has identified this signal:
Near support of triangle
Type : Bullish
Timeframe : Daily
The presence of a bearish pattern in Japanese candlesticks detected by Central Candlesticks that could cause a correction in the very short term was also detected:
Bearish engulfing lines
Type : Bearish
Timeframe : Daily
| S3 | S2 | S1 | Price | R1 | R2 | |
|---|---|---|---|---|---|---|
| ProTrendLines | 1,041 | 1,088 | 1,120 | 1,160 | 1,190 | 1,263 |
| Change (%) | -10.26% | -6.21% | -3.45% | - | +2.59% | +8.88% |
| Change | -119 | -72 | -40 | - | +30 | +103 |
| Level | Intermediate | Intermediate | Major | - | Major | Major |
Pivot points can also be used to set your price objectives. Here is the price situation in relation to pivot points:
| Pivot points | S3 | S2 | S1 | PP | R1 | R2 | R3 |
|---|---|---|---|---|---|---|---|
| Standard | 1,122 | 1,134 | 1,142 | 1,154 | 1,162 | 1,174 | 1,182 |
| Camarilla | 1,144 | 1,145 | 1,147 | 1,149 | 1,151 | 1,153 | 1,155 |
| Woodie | 1,135 | 1,143 | 1,152 | 1,160 | 1,169 | 1,177 | 1,186 |
| Fibonacci | 1,143 | 1,150 | 1,154 | 1,160 | 1,167 | 1,171 | 1,177 |
| Pivot points | S3 | S2 | S1 | PP | R1 | R2 | R3 |
|---|---|---|---|---|---|---|---|
| Standard | 1,042 | 1,088 | 1,126 | 1,172 | 1,210 | 1,256 | 1,294 |
| Camarilla | 1,141 | 1,149 | 1,156 | 1,164 | 1,172 | 1,179 | 1,187 |
| Woodie | 1,038 | 1,086 | 1,122 | 1,170 | 1,206 | 1,254 | 1,290 |
| Fibonacci | 1,088 | 1,120 | 1,140 | 1,172 | 1,204 | 1,224 | 1,256 |
| Pivot points | S3 | S2 | S1 | PP | R1 | R2 | R3 |
|---|---|---|---|---|---|---|---|
| Standard | 1,004 | 1,050 | 1,105 | 1,151 | 1,206 | 1,252 | 1,307 |
| Camarilla | 1,131 | 1,141 | 1,150 | 1,159 | 1,168 | 1,178 | 1,187 |
| Woodie | 1,008 | 1,052 | 1,109 | 1,153 | 1,210 | 1,254 | 1,311 |
| Fibonacci | 1,050 | 1,089 | 1,113 | 1,151 | 1,190 | 1,214 | 1,252 |
Numerical data
The following is the status of technical indicators and moving averages registered at the time this technical analysis was created:
| RSI (14): | 51.00 | |
| MACD (12,26,9): | 3.0000 | |
| Directional Movement: | 1 | |
| AROON (14): | 22 | |
| DEMA (21): | 1,162 | |
| Parabolic SAR (0,02-0,02-0,2): | 1,147 | |
| Elder Ray (13): | 4 | |
| Super Trend (3,10): | 1,119 | |
| Zig ZAG (10): | 1,160 | |
| VORTEX (21): | 1.0000 | |
| Stochastique (14,3,5): | 32.00 | |
| TEMA (21): | 1,163 | |
| Williams %R (14): | -66.00 | |
| Chande Momentum Oscillator (20): | 18 | |
| Repulse (5,40,3): | -2.0000 | |
| ROCnROLL: | 1 | |
| TRIX (15,9): | 0.0000 | |
| Courbe Coppock: | 2.00 |
| MA7: | 1,160 | |
| MA20: | 1,157 | |
| MA50: | 1,156 | |
| MA100: | 1,146 | |
| MAexp7: | 1,160 | |
| MAexp20: | 1,158 | |
| MAexp50: | 1,153 | |
| MAexp100: | 1,141 | |
| Price / MA7: | -0% | |
| Price / MA20: | +0.26% | |
| Price / MA50: | +0.35% | |
| Price / MA100: | +1.22% | |
| Price / MAexp7: | -0% | |
| Price / MAexp20: | +0.17% | |
| Price / MAexp50: | +0.61% | |
| Price / MAexp100: | +1.67% |
About author

Online


Add a comment
Comments
0 comments on the analysis HOMESERVE ORD 2 9/13P - Daily