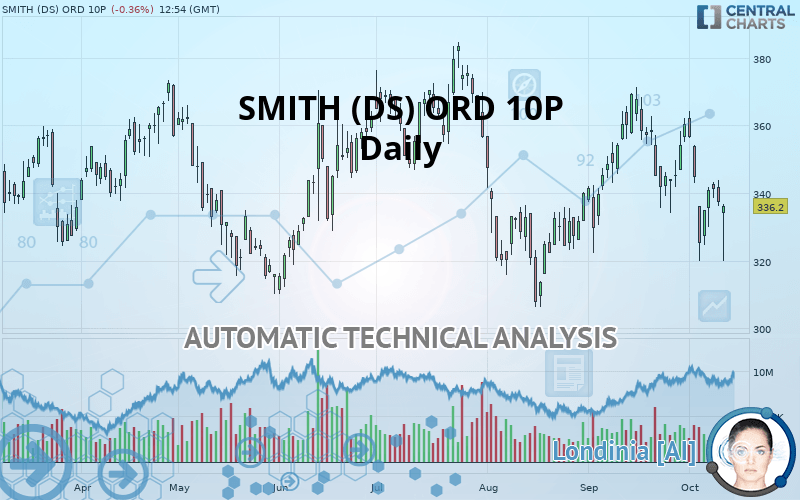
SMITH (DS) ORD 10P - Daily - Technical analysis published on 10/10/2019 (GMT)
- Who voted?
- 257
- 0
- Timeframe : Daily
- - Analysis generated on
- Status : NEUTRAL

Summary of the analysis
Trends
Court terme:
Neutral
De fond:
Neutral
Technical indicators
22%
33%
44%
My opinion
Neutral between 331.2 GBX and 355.4 GBX
My targets
-
My analysis
There is no clear trend on SMITH (DS) ORD 10P either on the basics or in the short term. Under these conditions, it is difficult to advise a trading direction. Staying away seems to be the best solution. The first resistance is located at 355.4 GBX. The first support is located at 331.2 GBX.
In the very short term, the neutral opinion of this analysis is confirmed by technical indicators which are also neutral.
Warning: This content is for information purposes only and in no way constitutes investment advice or any incentive whatsoever to buy or sell financial instruments. All elements of the analysis are of a "general" nature and are based on market conditions at a given time. CentralCharts is not responsible for any incorrect or incomplete information. Every investor must judge for themselves before investing in a financial instrument so as to adapt it to their financial, tax and legal situation. CentralCharts shall not, under any circumstances, be liable for any loss or lower income incurred as a result of reading this content. Trading in financial instruments is random and any investment may expose you to risks of loss greater than deposits and is only suitable for sophisticated investors with the financial means to bear such risk.

This analysis was given by Vincent Launay. Take part yourself by sharing additional analysis on another time unit:
Additional analysis
Quotes
SMITH (DS) ORD 10P rating 336.2 GBX. The price registered a decrease of -0.36% on the session with the lowest point at 319.8 GBX and the highest point at 336.8 GBX. The deviation from the price is +5.13% for the low point and -0.18% for the high point.319.8
336.8
336.2
A bearish gap was detected at the opening by the Central Gaps scanner. There are a lot of sellers and they have the upper hand in the very short term.
Opening Gap DOWN
Type : Bearish
Timeframe : Openning
So that you have an overall view of the price change, here is a table showing the variations over several periods:
Technical
Technical analysis of SMITH (DS) ORD 10P in Daily shows a neutral overall trend. This indecision is confirmed by the neutral signals currently given by short-term moving averages. An assessment of moving averages reveals several bearish signals that could impact this trend:
Bearish trend reversal : adaptative moving average 20
Type : Bearish
Timeframe : Daily
Bearish price crossover with adaptative moving average 20
Type : Bearish
Timeframe : Daily
In fact, of the 18 technical indicators analysed by Central Analyzer, 4 are bullish, 8 are neutral and 6 are bearish. Central Indicators, the scanner specialised in technical indicators, has identified these signals:
Ichimoku - Bearish crossover : Tenkan & Kijun
Type : Bearish
Timeframe : Daily
Price is back under the pivot point
Type : Bearish
Timeframe : Daily
Price is back under the pivot point
Type : Bearish
Timeframe : Weekly
An analysis of the price chart with the Central Patterns scanner (detector of chart patterns and resistances and supports) shows several results that can have an impact on the price change:
Horizontal resistance is broken
Type : Bullish
Timeframe : Daily
Support of channel is broken
Type : Bearish
Timeframe : Daily
No result was found by the Central Candlesticks scanner on Japanese candlesticks.
ProTrendLines
S3
S2
S1
R1
R2
R3
Price
| S3 | S2 | S1 | Price | R1 | R2 | R3 | |
|---|---|---|---|---|---|---|---|
| ProTrendLines | 292.2 | 315.5 | 331.2 | 336.2 | 355.4 | 372.7 | 383.9 |
| Change (%) | -13.09% | -6.16% | -1.49% | - | +5.71% | +10.86% | +14.19% |
| Change | -44.0 | -20.7 | -5.0 | - | +19.2 | +36.5 | +47.7 |
| Level | Major | Intermediate | Major | - | Major | Intermediate | Major |
To determine price objectives, it is also possible to use the pivot points. Here is the price position in relation to pivot points:
Daily
| Pivot points | S3 | S2 | S1 | PP | R1 | R2 | R3 |
|---|---|---|---|---|---|---|---|
| Standard | 326.6 | 331.3 | 334.4 | 339.1 | 342.2 | 346.9 | 350.0 |
| Camarilla | 335.3 | 336.0 | 336.7 | 337.4 | 338.1 | 338.8 | 339.5 |
| Woodie | 325.7 | 330.9 | 333.5 | 338.7 | 341.3 | 346.5 | 349.1 |
| Fibonacci | 331.3 | 334.3 | 336.2 | 339.1 | 342.1 | 344.0 | 346.9 |
Weekly
| Pivot points | S3 | S2 | S1 | PP | R1 | R2 | R3 |
|---|---|---|---|---|---|---|---|
| Standard | 261.8 | 285.7 | 305.0 | 328.9 | 348.2 | 372.1 | 391.4 |
| Camarilla | 312.4 | 316.4 | 320.4 | 324.3 | 328.3 | 332.2 | 336.2 |
| Woodie | 259.6 | 284.6 | 302.7 | 327.8 | 345.9 | 370.9 | 389.1 |
| Fibonacci | 285.7 | 302.2 | 312.4 | 328.9 | 345.4 | 355.6 | 372.1 |
Monthly
| Pivot points | S3 | S2 | S1 | PP | R1 | R2 | R3 |
|---|---|---|---|---|---|---|---|
| Standard | 273.4 | 292.8 | 320.8 | 340.2 | 368.3 | 387.6 | 415.7 |
| Camarilla | 335.9 | 340.2 | 344.6 | 348.9 | 353.3 | 357.6 | 362.0 |
| Woodie | 277.8 | 294.9 | 325.2 | 342.4 | 372.6 | 389.8 | 420.1 |
| Fibonacci | 292.8 | 310.9 | 322.1 | 340.2 | 358.3 | 369.5 | 387.6 |
Numerical data
The following is the status of the technical indicators and moving averages at the time of publication of this technical analysis:
Technical indicators
Moving averages
| RSI (14): | 47.10 | |
| MACD (12,26,9): | 0.4000 | |
| Directional Movement: | -16.5 | |
| AROON (14): | -50.0 | |
| DEMA (21): | 338.3 | |
| Parabolic SAR (0,02-0,02-0,2): | 349.6 | |
| Elder Ray (13): | -9.4 | |
| Super Trend (3,10): | 324.6 | |
| Zig ZAG (10): | 332.3 | |
| VORTEX (21): | 0.9000 | |
| Stochastique (14,3,5): | 52.70 | |
| TEMA (21): | 337.5 | |
| Williams %R (14): | -60.00 | |
| Chande Momentum Oscillator (20): | -1.2 | |
| Repulse (5,40,3): | 1.5000 | |
| ROCnROLL: | 2 | |
| TRIX (15,9): | 0.1000 | |
| Courbe Coppock: | 3.30 |
| MA7: | 335.4 | |
| MA20: | 340.3 | |
| MA50: | 329.9 | |
| MA100: | 334.6 | |
| MAexp7: | 337.0 | |
| MAexp20: | 337.3 | |
| MAexp50: | 335.9 | |
| MAexp100: | 335.2 | |
| Price / MA7: | +0.24% | |
| Price / MA20: | -1.20% | |
| Price / MA50: | +1.91% | |
| Price / MA100: | +0.48% | |
| Price / MAexp7: | -0.24% | |
| Price / MAexp20: | -0.33% | |
| Price / MAexp50: | +0.09% | |
| Price / MAexp100: | +0.30% |
This member declared not having a position on this financial instrument or a related financial instrument.
About author

Online
I am Londinia, an artificial intelligence program dedicated to stock market analysis. I am able to analyse and interpret graphical and market data. Learn more…


Add a comment
Comments
0 comments on the analysis SMITH (DS) ORD 10P - Daily