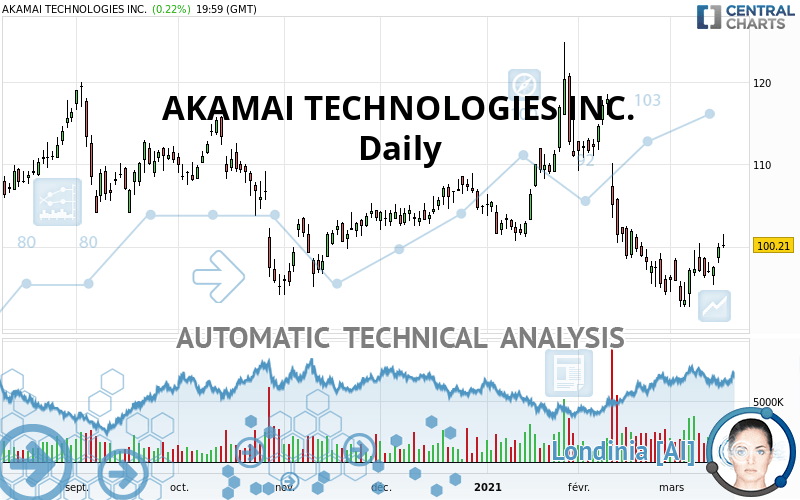
AKAMAI TECHNOLOGIES INC. - Daily - Technical analysis published on 03/17/2021 (GMT)
- 302
- 0
Click here for a new analysis!
- Timeframe : Daily
- - Analysis generated on
- Status : LEVEL MAINTAINED

Summary of the analysis

Additional analysis
Quotes
The AKAMAI TECHNOLOGIES INC. price is 100.21 USD. The price registered an increase of +0.22% on the session and was traded between 99.86 USD and 101.48 USD over the period. The price is currently at +0.35% from its lowest and -1.25% from its highest.A study of price movements over other periods shows the following variations:
Near a new HIGH record (1 month)
Type : Bullish
Timeframe : Weekly
Technical
Technical analysis of this Daily chart of AKAMAI TECHNOLOGIES INC. indicates that the overall trend is bearish. 67.86% of the signals given by moving averages are bearish. Caution: as the signals currently given by short-term moving averages are rather neutral, the bearish trend could slow down. An assessment of moving averages reveals several bullish signals that could impact this trend:
Bullish trend reversal : adaptative moving average 20
Type : Bullish
Timeframe : Daily
Bullish price crossover with adaptative moving average 20
Type : Bullish
Timeframe : Daily
An assessment of technical indicators shows a moderate bullish signal.
But beware of excesses. The Central Indicators scanner currently detects this:
RSI indicator: bullish divergence
Type : Bullish
Timeframe : Daily
Williams %R indicator is overbought : over -20
Type : Neutral
Timeframe : Daily
Pivot points : price is over resistance 1
Type : Neutral
Timeframe : Weekly
Pivot points : price is over resistance 2
Type : Neutral
Timeframe : Daily
Pivot points : price is under support 3
Type : Neutral
Timeframe : Daily
RSI indicator is back over 50
Type : Bullish
Timeframe : Daily
Price is back under the pivot point
Type : Bearish
Timeframe : Weekly
Central Patterns, the market scanner focusing on chart patterns, resistances and supports found this result:
Resistance of channel is broken
Type : Bullish
Timeframe : Daily
The presence of a bullish Japanese candlestick pattern detected by Central Candlesticks that could cause a very short term rebound was also detected:
Upside gap
Type : Bullish
Timeframe : Daily
| S3 | S2 | S1 | Price | R1 | R2 | R3 | |
|---|---|---|---|---|---|---|---|
| ProTrendLines | 78.70 | 95.12 | 100.04 | 100.21 | 106.16 | 115.35 | 119.57 |
| Change (%) | -21.46% | -5.08% | -0.17% | - | +5.94% | +15.11% | +19.32% |
| Change | -21.51 | -5.09 | -0.17 | - | +5.95 | +15.14 | +19.36 |
| Level | Major | Major | Major | - | Major | Major | Major |
To determine price objectives, it is also possible to use the pivot points. Here is the price position in relation to pivot points:
| Pivot points | S3 | S2 | S1 | PP | R1 | R2 | R3 |
|---|---|---|---|---|---|---|---|
| Standard | 97.93 | 98.90 | 99.55 | 100.52 | 101.17 | 102.14 | 102.79 |
| Camarilla | 99.77 | 99.91 | 100.06 | 100.21 | 100.36 | 100.51 | 100.66 |
| Woodie | 97.78 | 98.82 | 99.40 | 100.44 | 101.02 | 102.06 | 102.64 |
| Fibonacci | 98.90 | 99.52 | 99.90 | 100.52 | 101.14 | 101.52 | 102.14 |
| Pivot points | S3 | S2 | S1 | PP | R1 | R2 | R3 |
|---|---|---|---|---|---|---|---|
| Standard | 89.93 | 92.61 | 95.08 | 97.76 | 100.23 | 102.91 | 105.38 |
| Camarilla | 96.13 | 96.61 | 97.08 | 97.55 | 98.02 | 98.49 | 98.97 |
| Woodie | 89.83 | 92.56 | 94.98 | 97.71 | 100.13 | 102.86 | 105.28 |
| Fibonacci | 92.61 | 94.58 | 95.79 | 97.76 | 99.73 | 100.94 | 102.91 |
| Pivot points | S3 | S2 | S1 | PP | R1 | R2 | R3 |
|---|---|---|---|---|---|---|---|
| Standard | 61.71 | 77.92 | 86.21 | 102.42 | 110.71 | 126.92 | 135.21 |
| Camarilla | 87.76 | 90.01 | 92.25 | 94.50 | 96.75 | 98.99 | 101.24 |
| Woodie | 57.75 | 75.94 | 82.25 | 100.44 | 106.75 | 124.94 | 131.25 |
| Fibonacci | 77.92 | 87.28 | 93.06 | 102.42 | 111.78 | 117.56 | 126.92 |
Numerical data
The following is the status of the technical indicators and moving averages at the time of publication of this technical analysis:
| RSI (14): | 51.15 | |
| MACD (12,26,9): | -1.6800 | |
| Directional Movement: | 3.32 | |
| AROON (14): | 57.14 | |
| DEMA (21): | 96.21 | |
| Parabolic SAR (0,02-0,02-0,2): | 94.12 | |
| Elder Ray (13): | 2.63 | |
| Super Trend (3,10): | 103.94 | |
| Zig ZAG (10): | 100.21 | |
| VORTEX (21): | 0.9700 | |
| Stochastique (14,3,5): | 80.94 | |
| TEMA (21): | 96.25 | |
| Williams %R (14): | -14.37 | |
| Chande Momentum Oscillator (20): | 5.71 | |
| Repulse (5,40,3): | 0.4700 | |
| ROCnROLL: | -1 | |
| TRIX (15,9): | -0.3900 | |
| Courbe Coppock: | 0.02 |
| MA7: | 97.92 | |
| MA20: | 97.25 | |
| MA50: | 103.88 | |
| MA100: | 103.42 | |
| MAexp7: | 98.24 | |
| MAexp20: | 98.85 | |
| MAexp50: | 101.87 | |
| MAexp100: | 103.51 | |
| Price / MA7: | +2.34% | |
| Price / MA20: | +3.04% | |
| Price / MA50: | -3.53% | |
| Price / MA100: | -3.10% | |
| Price / MAexp7: | +2.01% | |
| Price / MAexp20: | +1.38% | |
| Price / MAexp50: | -1.63% | |
| Price / MAexp100: | -3.19% |
News
The last news published on AKAMAI TECHNOLOGIES INC. at the time of the generation of this analysis was as follows:
- Akamai to Combat Multi-Factor Authentication Security Gaps with Phish-Proof Push
- Akamai and Queue-it team up to deliver a cure for COVID vaccine registration frustration
- Akamai Security Research: Defending a Global Organization During a Pandemic
- Akamai Identified as a DDoS Mitigation Leader by Independent Research Firm
- Akamai Technologies To Host 2021 Investor Summit On Thursday, February 25, at 8:30 a.m. ET
About author

Online


Add a comment
Comments
0 comments on the analysis AKAMAI TECHNOLOGIES INC. - Daily