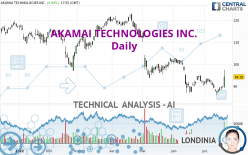
AKAMAI TECHNOLOGIES INC. - Daily - Technical analysis published on 07/21/2022 (GMT)
- 199
- 0
Click here for a new analysis!
- Timeframe : Daily
- - Analysis generated on
- Status : LEVEL MAINTAINED

Summary of the analysis

Additional analysis
Quotes
The AKAMAI TECHNOLOGIES INC. rating is 94.19 USD. The price has increased by +4.90% since the last closing and was between 89.11 USD and 97.49 USD. This implies that the price is at +5.70% from its lowest and at -3.38% from its highest.The Central Gaps scanner detects a bullish opening marking the presence of buyers ahead of sellers at the opening but not sufficiently marked to allow the price to register a quotation gap.
Bullish opening
Type : Bullish
Timeframe : Openning
A study of price movements over other periods shows the following variations:
Near a new LOW record (1 year)
Type : Bearish
Timeframe : Weekly
Near a new LOW record (1st january)
Type : Bearish
Timeframe : Weekly
New HIGH record (1 month)
Type : Bullish
Timeframe : Weekly
Technical
Technical analysis of AKAMAI TECHNOLOGIES INC. in Daily shows an overall bearish trend. 71.43% of the signals given by moving averages are bearish. Caution: as the signals currently given by short-term moving averages are rather neutral, the bearish trend could slow down. The Central Indicators scanner detects bullish signals on moving averages that could impact this trend:
Bullish price crossover with Moving Average 20
Type : Bullish
Timeframe : Daily
Bullish price crossover with adaptative moving average 50
Type : Bullish
Timeframe : Daily
In fact, according to the parameters integrated into the Central Analyzer system, 10 technical indicators out of 18 analysed are currently bullish. Other results related to technical indicators were also found by the Central Indicators scanner:
Pivot points : price is over resistance 1
Type : Neutral
Timeframe : Weekly
Pivot points : price is over resistance 3
Type : Neutral
Timeframe : Daily
RSI indicator is back over 50
Type : Bullish
Timeframe : Daily
Parabolic SAR indicator bullish reversal
Type : Bullish
Timeframe : Daily
Aroon indicator bullish trend
Type : Bullish
Timeframe : Daily
SuperTrend indicator bullish reversal
Type : Bullish
Timeframe : Daily
Momentum indicator is back over 0
Type : Bullish
Timeframe : Daily
Central Patterns, the market scanner focusing on chart patterns, resistances and supports found these results:
Near horizontal resistance
Type : Bearish
Timeframe : Daily
Resistance of channel is broken
Type : Bullish
Timeframe : Daily
For a small rebound in the very short term, the Central Candlesticks scanner currently notes the presence of this bullish pattern in Japanese candlesticks:
Long white line
Type : Bullish
Timeframe : Daily
| S3 | S2 | S1 | Price | R1 | R2 | R3 | |
|---|---|---|---|---|---|---|---|
| ProTrendLines | 78.36 | 87.46 | 93.31 | 94.19 | 98.88 | 106.16 | 114.20 |
| Change (%) | -16.81% | -7.15% | -0.93% | - | +4.98% | +12.71% | +21.24% |
| Change | -15.83 | -6.73 | -0.88 | - | +4.69 | +11.97 | +20.01 |
| Level | Major | Major | Intermediate | - | Intermediate | Intermediate | Minor |
Attention could also be paid to pivot points to set price objectives:
| Pivot points | S3 | S2 | S1 | PP | R1 | R2 | R3 |
|---|---|---|---|---|---|---|---|
| Standard | 87.99 | 88.51 | 89.15 | 89.67 | 90.31 | 90.83 | 91.47 |
| Camarilla | 89.47 | 89.58 | 89.68 | 89.79 | 89.90 | 90.00 | 90.11 |
| Woodie | 88.05 | 88.54 | 89.21 | 89.70 | 90.37 | 90.86 | 91.53 |
| Fibonacci | 88.51 | 88.95 | 89.23 | 89.67 | 90.11 | 90.39 | 90.83 |
| Pivot points | S3 | S2 | S1 | PP | R1 | R2 | R3 |
|---|---|---|---|---|---|---|---|
| Standard | 79.53 | 82.72 | 85.56 | 88.75 | 91.59 | 94.78 | 97.62 |
| Camarilla | 86.75 | 87.31 | 87.86 | 88.41 | 88.96 | 89.52 | 90.07 |
| Woodie | 79.37 | 82.63 | 85.40 | 88.66 | 91.43 | 94.69 | 97.46 |
| Fibonacci | 82.72 | 85.02 | 86.44 | 88.75 | 91.05 | 92.47 | 94.78 |
| Pivot points | S3 | S2 | S1 | PP | R1 | R2 | R3 |
|---|---|---|---|---|---|---|---|
| Standard | 68.83 | 77.91 | 84.62 | 93.70 | 100.41 | 109.49 | 116.20 |
| Camarilla | 86.99 | 88.44 | 89.88 | 91.33 | 92.78 | 94.23 | 95.67 |
| Woodie | 67.65 | 77.32 | 83.44 | 93.11 | 99.23 | 108.90 | 115.02 |
| Fibonacci | 77.91 | 83.94 | 87.67 | 93.70 | 99.73 | 103.46 | 109.49 |
Numerical data
The following is the status of the technical indicators and moving averages at the time of publication of this technical analysis:
| RSI (14): | 54.45 | |
| MACD (12,26,9): | -1.5500 | |
| Directional Movement: | 10.41 | |
| AROON (14): | 35.71 | |
| DEMA (21): | 88.83 | |
| Parabolic SAR (0,02-0,02-0,2): | 85.90 | |
| Elder Ray (13): | 2.79 | |
| Super Trend (3,10): | 85.53 | |
| Zig ZAG (10): | 93.83 | |
| VORTEX (21): | 0.9200 | |
| Stochastique (14,3,5): | 54.94 | |
| TEMA (21): | 89.66 | |
| Williams %R (14): | -33.52 | |
| Chande Momentum Oscillator (20): | 0.51 | |
| Repulse (5,40,3): | 3.1800 | |
| ROCnROLL: | -1 | |
| TRIX (15,9): | -0.3100 | |
| Courbe Coppock: | 5.57 |
| MA7: | 89.23 | |
| MA20: | 91.21 | |
| MA50: | 94.84 | |
| MA100: | 104.55 | |
| MAexp7: | 90.43 | |
| MAexp20: | 91.25 | |
| MAexp50: | 95.60 | |
| MAexp100: | 100.88 | |
| Price / MA7: | +5.56% | |
| Price / MA20: | +3.27% | |
| Price / MA50: | -0.69% | |
| Price / MA100: | -9.91% | |
| Price / MAexp7: | +4.16% | |
| Price / MAexp20: | +3.22% | |
| Price / MAexp50: | -1.47% | |
| Price / MAexp100: | -6.63% |
News
Don't forget to follow the news on AKAMAI TECHNOLOGIES INC.. At the time of publication of this analysis, the latest news was as follows:
- Akamai Technologies To Hold Second Quarter 2022 Investor Conference Call On Tuesday, August 9, at 4:30 PM ET
- Akamai Awards $1M in Products and Services to Future of Life Online Challenge Winner Bloomfield Robotics
- Akamai Reveals New Research on Top Three Internet Security Threats
- Akamai Launches New Malware Protection for Uploaded Files
- Akamai Launches First NFT Artwork Dynamically Fueled by the Internet
About author
Online


Add a comment
Comments
0 comments on the analysis AKAMAI TECHNOLOGIES INC. - Daily