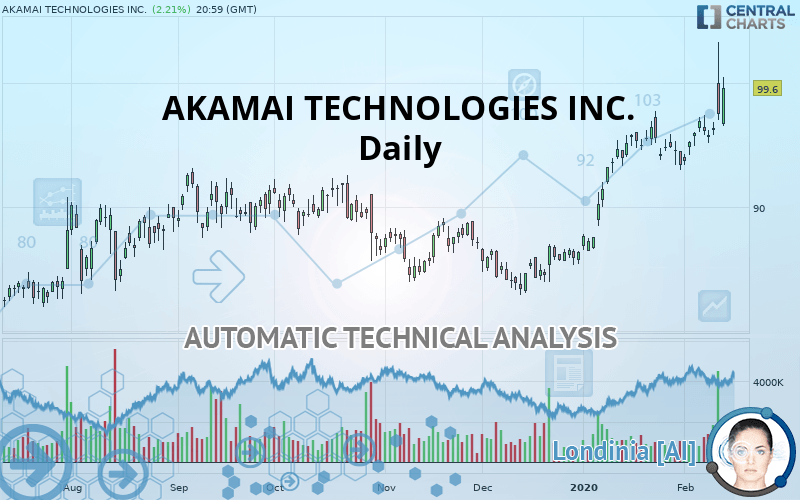
AKAMAI TECHNOLOGIES INC. - Daily - Technical analysis published on 02/14/2020 (GMT)
- Who voted?
- 373
- 0
Click here for a new analysis!
- Timeframe : Daily
- - Analysis generated on
- Status : INVALID

Summary of the analysis

Additional analysis
Quotes
The AKAMAI TECHNOLOGIES INC. rating is 99.60 USD. The price has increased by +2.21% since the last closing and was between 96.53 USD and 100.49 USD. This implies that the price is at +3.18% from its lowest and at -0.89% from its highest.The Central Gaps scanner detects the formation of a bearish gap marking the strong presence of sellers ahead of buyers at the opening. This formed a quotation gap.
Opening Gap DOWN
Type : Bearish
Timeframe : Openning
Here is a more detailed summary of the historical variations registered by AKAMAI TECHNOLOGIES INC.:
New HIGH record (5 years)
Type : Bullish
Timeframe : Weekly
Near a new HIGH record (1 year)
Type : Bullish
Timeframe : Weekly
Near a new HIGH record (1st january)
Type : Bullish
Timeframe : Weekly
Near a new HIGH record (1 month)
Type : Bullish
Timeframe : Weekly
Technical
A technical analysis in Daily of this AKAMAI TECHNOLOGIES INC. chart shows a strongly bullish trend. 92.86% of the signals given by moving averages are bullish. This strongly bullish trend is supported by the strong bullish signals given by short-term moving averages. There is no crossing of moving average by the price or crossing of moving averages between themselves.
The probability of a further increase is high given the direction of the technical indicators.
Caution: the Central Indicators scanner currently detects an excess:
CCI indicator is overbought : over 100
Type : Neutral
Timeframe : Daily
Williams %R indicator is overbought : over -20
Type : Neutral
Timeframe : Daily
Pivot points : price is over resistance 1
Type : Neutral
Timeframe : Weekly
Aroon indicator bullish trend
Type : Bullish
Timeframe : Daily
Price is back under the pivot point
Type : Bearish
Timeframe : Daily
Williams %R indicator is back under -50
Type : Bearish
Timeframe : Daily
An analysis of the price chart with the Central Patterns scanner (detector of chart patterns and resistances and supports) shows a result that can have an impact on the price change:
Resistance of channel is broken
Type : Bullish
Timeframe : Daily
The presence of a bearish pattern in Japanese candlesticks detected by Central Candlesticks that could cause a correction in the very short term was also detected:
Long black line
Type : Bearish
Timeframe : Daily
| S3 | S2 | S1 | Price | |
|---|---|---|---|---|
| ProTrendLines | 82.58 | 88.69 | 96.44 | 99.60 |
| Change (%) | -17.09% | -10.95% | -3.17% | - |
| Change | -17.02 | -10.91 | -3.16 | - |
| Level | Major | Major | Major | - |
Pivot points can also be used to set your price objectives. Here is the price situation in relation to pivot points:
| Pivot points | S3 | S2 | S1 | PP | R1 | R2 | R3 |
|---|---|---|---|---|---|---|---|
| Standard | 88.91 | 92.96 | 95.20 | 99.25 | 101.49 | 105.54 | 107.78 |
| Camarilla | 95.72 | 96.30 | 96.87 | 97.45 | 98.03 | 98.60 | 99.18 |
| Woodie | 88.02 | 92.51 | 94.31 | 98.80 | 100.60 | 105.09 | 106.89 |
| Fibonacci | 92.96 | 95.36 | 96.84 | 99.25 | 101.65 | 103.13 | 105.54 |
| Pivot points | S3 | S2 | S1 | PP | R1 | R2 | R3 |
|---|---|---|---|---|---|---|---|
| Standard | 89.76 | 91.55 | 93.83 | 95.62 | 97.90 | 99.69 | 101.97 |
| Camarilla | 95.00 | 95.37 | 95.75 | 96.12 | 96.49 | 96.87 | 97.24 |
| Woodie | 90.02 | 91.67 | 94.09 | 95.74 | 98.16 | 99.81 | 102.23 |
| Fibonacci | 91.55 | 93.10 | 94.06 | 95.62 | 97.17 | 98.13 | 99.69 |
| Pivot points | S3 | S2 | S1 | PP | R1 | R2 | R3 |
|---|---|---|---|---|---|---|---|
| Standard | 75.90 | 81.15 | 87.25 | 92.50 | 98.60 | 103.85 | 109.95 |
| Camarilla | 90.23 | 91.27 | 92.31 | 93.35 | 94.39 | 95.43 | 96.47 |
| Woodie | 76.33 | 81.36 | 87.68 | 92.71 | 99.03 | 104.06 | 110.38 |
| Fibonacci | 81.15 | 85.49 | 88.16 | 92.50 | 96.84 | 99.51 | 103.85 |
Numerical data
The following is the status of the technical indicators and moving averages at the time of publication of this technical analysis:
| RSI (14): | 72.29 | |
| MACD (12,26,9): | 1.7700 | |
| Directional Movement: | 31.37 | |
| AROON (14): | 57.15 | |
| DEMA (21): | 97.65 | |
| Parabolic SAR (0,02-0,02-0,2): | 94.14 | |
| Elder Ray (13): | 2.34 | |
| Super Trend (3,10): | 94.32 | |
| Zig ZAG (10): | 99.60 | |
| VORTEX (21): | 1.0400 | |
| Stochastique (14,3,5): | 59.59 | |
| TEMA (21): | 97.91 | |
| Williams %R (14): | -35.76 | |
| Chande Momentum Oscillator (20): | 4.77 | |
| Repulse (5,40,3): | -0.0400 | |
| ROCnROLL: | 1 | |
| TRIX (15,9): | 0.2800 | |
| Courbe Coppock: | 3.25 |
| MA7: | 96.89 | |
| MA20: | 95.63 | |
| MA50: | 90.64 | |
| MA100: | 89.63 | |
| MAexp7: | 97.06 | |
| MAexp20: | 95.27 | |
| MAexp50: | 92.39 | |
| MAexp100: | 89.96 | |
| Price / MA7: | +2.80% | |
| Price / MA20: | +4.15% | |
| Price / MA50: | +9.89% | |
| Price / MA100: | +11.12% | |
| Price / MAexp7: | +2.62% | |
| Price / MAexp20: | +4.54% | |
| Price / MAexp50: | +7.80% | |
| Price / MAexp100: | +10.72% |
News
Don"t forget to follow the news on AKAMAI TECHNOLOGIES INC.. At the time of publication of this analysis, the latest news was as follows:
- Akamai Reports Fourth Quarter 2019 and Full-Year 2019 Financial Results
- Akamai Identified as a Bot Management Leader by Independent Research Firm
- Akamai Recognized as a January 2020 Gartner Peer Insights Customers' Choice for Web Application Firewalls
- Akamai Technologies To Hold Fourth Quarter and Full Year 2019 Investor Conference Call On Tuesday, February 11, at 4:30 PM ET
- Akamai Technologies Earns Top Marks In Human Rights Campaign's 2020 Corporate Equality Index
About author

Online


Add a comment
Comments
0 comments on the analysis AKAMAI TECHNOLOGIES INC. - Daily