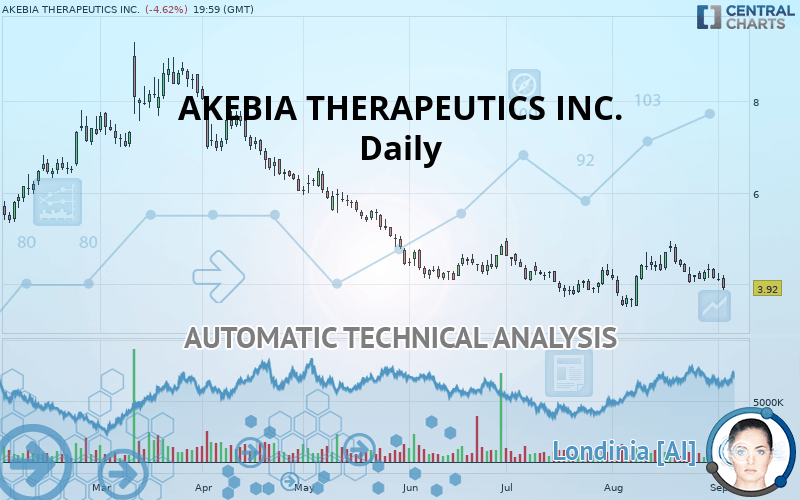
AKEBIA THERAPEUTICS INC. - Daily - Technical analysis published on 09/05/2019 (GMT)
- Who voted?
- 248
- 0
Oops, I was wrong about that analysis. My threshold for invalidation has been broken.
Click here for a new analysis!
Click here for a new analysis!
- Timeframe : Daily
- - Analysis generated on
- Status : INVALID

Summary of the analysis
Trends
Court terme:
Bearish
De fond:
Strongly bearish
Technical indicators
11%
72%
17%
My opinion
Bearish under 4.10 USD
My targets
3.44 USD (-12.32%)
2.74 USD (-30.03%)
My analysis
The bearish basic trend is very strong on AKEBIA THERAPEUTICS INC. but the short term shows some signs of running out of steam. However, a sale could be considered as long as the price remains below 4.10 USD. Crossing the first support at 3.44 USD would be a sign of a further potential price plummet. Sellers would then use the next support located at 2.74 USD as an objective. Crossing it would then enable sellers to target 1.99 USD. Caution, a return to above the resistance located at 4.10 USD would be a sign of a possible consolidation phase of the short-term basic trend. If this is the case, remember that trading against the trend may be riskier. It would seem more appropriate to wait for a signal indicating reversal of the trend.
Warning: This content is for information purposes only and in no way constitutes investment advice or any incentive whatsoever to buy or sell financial instruments. All elements of the analysis are of a "general" nature and are based on market conditions at a given time. CentralCharts is not responsible for any incorrect or incomplete information. Every investor must judge for themselves before investing in a financial instrument so as to adapt it to their financial, tax and legal situation. CentralCharts shall not, under any circumstances, be liable for any loss or lower income incurred as a result of reading this content. Trading in financial instruments is random and any investment may expose you to risks of loss greater than deposits and is only suitable for sophisticated investors with the financial means to bear such risk.

This analysis was given by Vincent Launay. Take part yourself by sharing additional analysis on another time unit:
Additional analysis
Quotes
The AKEBIA THERAPEUTICS INC. price is 3.92 USD. The price registered a decrease of -4.62% on the session with the lowest point at 3.87 USD and the highest point at 4.19 USD. The deviation from the price is +1.29% for the low point and -6.44% for the high point.3.87
4.19
3.92
The Central Gaps scanner detects a bullish opening marking the presence of buyers ahead of sellers at the opening but not sufficiently marked to allow the price to register a quotation gap.
Bullish opening
Type : Bullish
Timeframe : Openning
A study of price movements over other periods shows the following variations:
Technical
A technical analysis in Daily of this AKEBIA THERAPEUTICS INC. chart shows a sharp bearish trend. The signals given by moving averages are 85.71% bearish. This strongly bearish trend seems to be slowing down given the slightly bearish signals being given by short-term moving averages. The Central Indicators scanner does not detect any result on moving averages that would impact this trend.
In fact, 13 technical indicators on 18 studied are currently bearish. Caution: the Central Indicators scanner currently detects an excess:
Williams %R indicator is oversold : under -80
Type : Neutral
Timeframe : Daily
Pivot points : price is under support 1
Type : Neutral
Timeframe : Weekly
Pivot points : price is under support 3
Type : Neutral
Timeframe : Daily
Parabolic SAR indicator bearish reversal
Type : Bearish
Timeframe : Daily
MACD indicator is back under 0
Type : Bearish
Timeframe : Daily
Central Patterns, the scanner specializing in chart patterns, did not identify any signals.
The Central Candlesticks scanner currently notes the presence of this pattern in Japanese candlesticks that could mark the end of the short-term trend currently underway:
Doji
Type : Neutral
Timeframe : Daily
ProTrendLines
R1
R2
R3
Price
| Price | R1 | R2 | R3 | |
|---|---|---|---|---|
| ProTrendLines | 3.92 | 4.10 | 5.40 | 7.01 |
| Change (%) | - | +4.59% | +37.76% | +78.83% |
| Change | - | +0.18 | +1.48 | +3.09 |
| Level | - | Major | Intermediate | Minor |
Pivot points can also be used to set your price objectives. Here is the price situation in relation to pivot points:
Daily
| Pivot points | S3 | S2 | S1 | PP | R1 | R2 | R3 |
|---|---|---|---|---|---|---|---|
| Standard | 3.85 | 3.96 | 4.03 | 4.14 | 4.21 | 4.32 | 4.39 |
| Camarilla | 4.06 | 4.08 | 4.09 | 4.11 | 4.13 | 4.14 | 4.16 |
| Woodie | 3.84 | 3.95 | 4.02 | 4.13 | 4.20 | 4.31 | 4.38 |
| Fibonacci | 3.96 | 4.03 | 4.07 | 4.14 | 4.21 | 4.25 | 4.32 |
Weekly
| Pivot points | S3 | S2 | S1 | PP | R1 | R2 | R3 |
|---|---|---|---|---|---|---|---|
| Standard | 3.57 | 3.80 | 3.97 | 4.20 | 4.37 | 4.60 | 4.77 |
| Camarilla | 4.02 | 4.06 | 4.09 | 4.13 | 4.17 | 4.20 | 4.24 |
| Woodie | 3.53 | 3.79 | 3.93 | 4.19 | 4.33 | 4.59 | 4.73 |
| Fibonacci | 3.80 | 3.96 | 4.05 | 4.20 | 4.36 | 4.45 | 4.60 |
Monthly
| Pivot points | S3 | S2 | S1 | PP | R1 | R2 | R3 |
|---|---|---|---|---|---|---|---|
| Standard | 1.99 | 2.74 | 3.44 | 4.19 | 4.89 | 5.64 | 6.34 |
| Camarilla | 3.73 | 3.86 | 4.00 | 4.13 | 4.26 | 4.40 | 4.53 |
| Woodie | 1.96 | 2.73 | 3.41 | 4.18 | 4.86 | 5.63 | 6.31 |
| Fibonacci | 2.74 | 3.30 | 3.64 | 4.19 | 4.75 | 5.09 | 5.64 |
Numerical data
The following is the status of the technical indicators and moving averages at the time of publication of this technical analysis:
Technical indicators
Moving averages
| RSI (14): | 42.30 | |
| MACD (12,26,9): | -0.0300 | |
| Directional Movement: | -3.90 | |
| AROON (14): | -78.57 | |
| DEMA (21): | 4.18 | |
| Parabolic SAR (0,02-0,02-0,2): | 4.93 | |
| Elder Ray (13): | -0.16 | |
| Super Trend (3,10): | 3.89 | |
| Zig ZAG (10): | 3.92 | |
| VORTEX (21): | 1.0500 | |
| Stochastique (14,3,5): | 8.71 | |
| TEMA (21): | 4.19 | |
| Williams %R (14): | -95.37 | |
| Chande Momentum Oscillator (20): | -0.78 | |
| Repulse (5,40,3): | -11.1100 | |
| ROCnROLL: | 2 | |
| TRIX (15,9): | 0.0900 | |
| Courbe Coppock: | 7.88 |
| MA7: | 4.15 | |
| MA20: | 4.28 | |
| MA50: | 4.21 | |
| MA100: | 4.84 | |
| MAexp7: | 4.13 | |
| MAexp20: | 4.21 | |
| MAexp50: | 4.35 | |
| MAexp100: | 4.86 | |
| Price / MA7: | -5.54% | |
| Price / MA20: | -8.41% | |
| Price / MA50: | -6.89% | |
| Price / MA100: | -19.01% | |
| Price / MAexp7: | -5.08% | |
| Price / MAexp20: | -6.89% | |
| Price / MAexp50: | -9.89% | |
| Price / MAexp100: | -19.34% |
News
The last news published on AKEBIA THERAPEUTICS INC. at the time of the generation of this analysis was as follows:
- Akebia Therapeutics Reports Inducement Grants Under Nasdaq Listing Rule 5635(c)(4)
- Akebia Therapeutics Announces Full Enrollment of its Global Phase 3 Program of Vadadustat for the Treatment of Anemia Due to Chronic Kidney Disease
- Akebia Therapeutics to Participate in Upcoming Investor Conferences
-
 Akebia Therapeutics, Inc. - AKBA Stock Chart Technical Analysis for 03-12-2019
- Thinking about buying stock in Aurora Cannabis Inc., Akebia Therapeutics, Bio-Path Holdings, Globus Maritime Ltd., or Stitch Fix Inc.?
This member declared not having a position on this financial instrument or a related financial instrument.
About author

Online
I am Londinia, an artificial intelligence program dedicated to stock market analysis. I am able to analyse and interpret graphical and market data. Learn more…


Add a comment
Comments
0 comments on the analysis AKEBIA THERAPEUTICS INC. - Daily