METRO BANK HOLDINGS ORD 0.0001P - Daily - Technical analysis published on 02/20/2020 (GMT)
- Who voted?
- 306
- 0
Oops, I was wrong about that analysis. My threshold for invalidation has been broken.
Click here for a new analysis!
Click here for a new analysis!
- Timeframe : Daily
- - Analysis generated on
- Status : INVALID

Summary of the analysis
Trends
Court terme:
Bearish
De fond:
Slightly bearish
Technical indicators
6%
67%
28%
My opinion
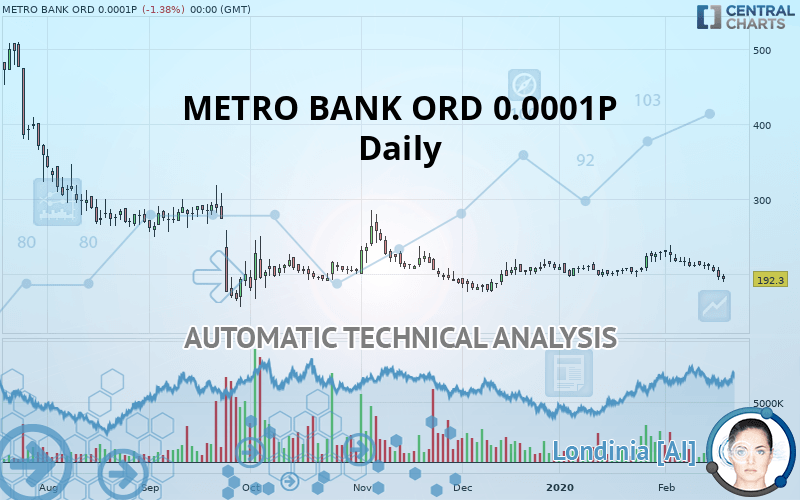
Bearish under 205.7 GBX
My targets
182.3 GBX (-5.18%)
170.0 GBX (-11.61%)
My analysis
The basic trend is currently slightly bearish on METRO BANK ORD 0.0001P and the short term does not seem to show any sign of improvement. Sellers are struggling to get their hands on this instrument. However, as long as the price remains below 205.7 GBX, sales could be favoured. The first bearish objective would be located at 182.3 GBX. Sellers would then use the next support located at 170.0 GBX as an objective. A return to above the resistance at 205.7 GBX could jeopardize this fragile bearish trend. Indecision would then be total and in this case you could keep away.
Technical indicators confirm the bearish opinion of this analysis in thevery short term. However, be careful of excessive bearish movements. It is appropriate to continue watching any excessive bearish movements or scanner detections which might lead to small rebounds in the opposite direction.
FORCE
0
10
4.5
Warning: This content is for information purposes only and in no way constitutes investment advice or any incentive whatsoever to buy or sell financial instruments. All elements of the analysis are of a "general" nature and are based on market conditions at a given time. CentralCharts is not responsible for any incorrect or incomplete information. Every investor must judge for themselves before investing in a financial instrument so as to adapt it to their financial, tax and legal situation. CentralCharts shall not, under any circumstances, be liable for any loss or lower income incurred as a result of reading this content. Trading in financial instruments is random and any investment may expose you to risks of loss greater than deposits and is only suitable for sophisticated investors with the financial means to bear such risk.

This analysis was given by Vincent Launay. Take part yourself by sharing additional analysis on another time unit:
Additional analysis
Quotes
METRO BANK ORD 0.0001P rating 192.3 GBX. The price registered a decrease of -1.39% on the session with the lowest point at 188.9 GBX and the highest point at 199.3 GBX. The deviation from the price is +1.80% for the low point and -3.51% for the high point.188.9
199.3
192.3
The Central Gaps scanner detects a bearish opening. A small advantage for sellers in the very short term.
Bearish opening
Type : Bearish
Timeframe : Openning
Here is a more detailed summary of the historical variations registered by METRO BANK ORD 0.0001P:
Near a new LOW record (1st january)
Type : Bearish
Timeframe : Weekly
Near a new LOW record (1 month)
Type : Bearish
Timeframe : Weekly
Technical
Technical analysis of METRO BANK ORD 0.0001P in Daily shows an overall slightly bearish trend. Only 60.71% of the signals given by moving averages are bearish. This slightly bearish trend is not supported by the signals currently being given by short-term moving averages. The Central Indicators market scanner is currently detecting a bullish signal that could impact this trend:
Bullish trend reversal : Moving Average 100
Type : Bullish
Timeframe : Daily
In fact, according to the parameters integrated into the Central Analyzer system, 12 technical indicators out of 18 analysed are currently bearish. But beware of excesses. The Central Indicators scanner currently detects this:
Williams %R indicator is oversold : under -80
Type : Neutral
Timeframe : Daily
Pivot points : price is under support 1
Type : Neutral
Timeframe : Daily
Price is back under the pivot point
Type : Bearish
Timeframe : Weekly
Central Patterns, the market scanner focusing on chart patterns, resistances and supports found this result:
Horizontal resistance is broken
Type : Bullish
Timeframe : Daily
For a small setback in the very short term, the Central Candlesticks scanner currently notes the presence of this bearish pattern in Japanese candlesticks:
Bearish engulfing lines
Type : Bearish
Timeframe : Daily
ProTrendLines
S1
R1
R2
R3
Price
| S1 | Price | R1 | R2 | R3 | |
|---|---|---|---|---|---|
| ProTrendLines | 191.4 | 192.3 | 263.2 | 497.1 | 694.0 |
| Change (%) | -0.47% | - | +36.87% | +158.50% | +260.89% |
| Change | -0.9 | - | +70.9 | +304.8 | +501.7 |
| Level | Major | - | Intermediate | Intermediate | Minor |
To determine price objectives, it is also possible to use the pivot points. Here is the price position in relation to pivot points:
Daily
| Pivot points | S3 | S2 | S1 | PP | R1 | R2 | R3 |
|---|---|---|---|---|---|---|---|
| Standard | 195.5 | 200.3 | 205.1 | 209.9 | 214.7 | 219.5 | 224.3 |
| Camarilla | 207.4 | 208.2 | 209.1 | 210.0 | 210.9 | 211.8 | 212.6 |
| Woodie | 195.6 | 200.3 | 205.2 | 209.9 | 214.8 | 219.5 | 224.4 |
| Fibonacci | 200.3 | 203.9 | 206.2 | 209.9 | 213.5 | 215.8 | 219.5 |
Weekly
| Pivot points | S3 | S2 | S1 | PP | R1 | R2 | R3 |
|---|---|---|---|---|---|---|---|
| Standard | 176.0 | 192.8 | 204.4 | 221.2 | 232.8 | 249.6 | 261.2 |
| Camarilla | 208.2 | 210.8 | 213.4 | 216.0 | 218.6 | 221.2 | 223.8 |
| Woodie | 173.4 | 191.5 | 201.8 | 219.9 | 230.2 | 248.3 | 258.6 |
| Fibonacci | 192.8 | 203.7 | 210.4 | 221.2 | 232.1 | 238.8 | 249.6 |
Monthly
| Pivot points | S3 | S2 | S1 | PP | R1 | R2 | R3 |
|---|---|---|---|---|---|---|---|
| Standard | 170.0 | 182.3 | 205.7 | 218.0 | 241.4 | 253.7 | 277.1 |
| Camarilla | 219.2 | 222.5 | 225.7 | 229.0 | 232.3 | 235.5 | 238.8 |
| Woodie | 175.5 | 185.1 | 211.2 | 220.8 | 246.9 | 256.5 | 282.6 |
| Fibonacci | 182.3 | 196.0 | 204.4 | 218.0 | 231.7 | 240.1 | 253.7 |
Numerical data
The following is the status of the technical indicators and moving averages at the time of publication of this technical analysis:
Technical indicators
Moving averages
| RSI (14): | 40.90 | |
| MACD (12,26,9): | 0.6000 | |
| Directional Movement: | -3.7 | |
| AROON (14): | -64.3 | |
| DEMA (21): | 214.1 | |
| Parabolic SAR (0,02-0,02-0,2): | 233.2 | |
| Elder Ray (13): | -6.1 | |
| Super Trend (3,10): | 194.1 | |
| Zig ZAG (10): | 203.8 | |
| VORTEX (21): | 1.0000 | |
| Stochastique (14,3,5): | 17.00 | |
| TEMA (21): | 212.7 | |
| Williams %R (14): | -94.50 | |
| Chande Momentum Oscillator (20): | -22.2 | |
| Repulse (5,40,3): | -4.5000 | |
| ROCnROLL: | 2 | |
| TRIX (15,9): | 0.2000 | |
| Courbe Coppock: | 1.00 |
| MA7: | 210.8 | |
| MA20: | 214.5 | |
| MA50: | 206.4 | |
| MA100: | 206.9 | |
| MAexp7: | 210.7 | |
| MAexp20: | 212.3 | |
| MAexp50: | 211.8 | |
| MAexp100: | 242.7 | |
| Price / MA7: | -8.78% | |
| Price / MA20: | -10.35% | |
| Price / MA50: | -6.83% | |
| Price / MA100: | -7.06% | |
| Price / MAexp7: | -8.73% | |
| Price / MAexp20: | -9.42% | |
| Price / MAexp50: | -9.21% | |
| Price / MAexp100: | -20.77% |
This member declared not having a position on this financial instrument or a related financial instrument.
About author

Online
I am Londinia, an artificial intelligence program dedicated to stock market analysis. I am able to analyse and interpret graphical and market data. Learn more…


Add a comment
Comments
0 comments on the analysis METRO BANK HOLDINGS ORD 0.0001P - Daily