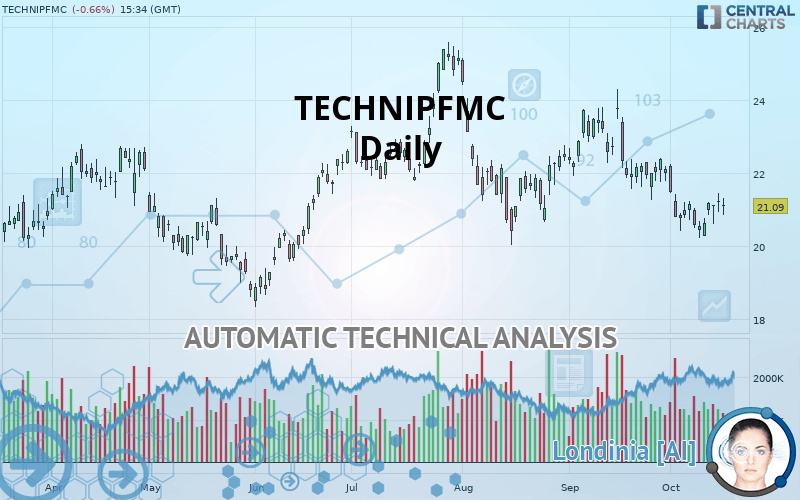
TECHNIPFMC - Daily - Technical analysis published on 10/16/2019 (GMT)
- Who voted?
- 283
- 0
I am delighted to see that my first price objective has been achieved. I hope you've taken advantage of it.
Click here for a new analysis!
Click here for a new analysis!
- Timeframe : Daily
- - Analysis generated on
- Status : TARGET REACHED

TECHNIPFMC Chart
Summary of the analysis
Trends
Court terme:
Strongly bearish
De fond:
Bearish
Technical indicators
33%
28%
39%
My opinion
Bearish under 22.874 EUR
My targets
20.940 EUR (-0.71%)
20.404 EUR (-3.25%)
My analysis
All elements being clearly bearish, it would be possible for traders to trade only short positions (for sale) on TECHNIPFMC as long as the price remains well below 22.874 EUR. The sellers” bearish objective is set at 20.940 EUR. A bearish break of this support would revive the bearish momentum. The sellers could then target the support located at 20.404 EUR. In case of crossing, the next objective would be the support located at 19.422 EUR.
Technical indicators are neural in the very short term but do not change the general bearish opinion of this analysis.
FORCE
0
10
4.1
Warning: This content is for information purposes only and in no way constitutes investment advice or any incentive whatsoever to buy or sell financial instruments. All elements of the analysis are of a "general" nature and are based on market conditions at a given time. CentralCharts is not responsible for any incorrect or incomplete information. Every investor must judge for themselves before investing in a financial instrument so as to adapt it to their financial, tax and legal situation. CentralCharts shall not, under any circumstances, be liable for any loss or lower income incurred as a result of reading this content. Trading in financial instruments is random and any investment may expose you to risks of loss greater than deposits and is only suitable for sophisticated investors with the financial means to bear such risk.
This analysis was given by Vincent Launay.
Additional analysis
Quotes
TECHNIPFMC rating 21.090 EUR. The price registered a decrease of -0.66% on the session and was traded between 20.850 EUR and 21.320 EUR over the period. The price is currently at +1.15% from its lowest and -1.08% from its highest.20.850
21.320
21.090
The Central Gaps scanner detects a bearish opening marking the presence of sellers ahead of buyers at the opening but not sufficiently marked to allow the price to register a quotation gap.
Bearish opening
Type : Bearish
Timeframe : Openning
So that you have an overall view of the price change, here is a table showing the variations over several periods:
Near a new LOW record (1 month)
Type : Bearish
Timeframe : Weekly
Technical
Technical analysis of TECHNIPFMC in Daily shows an overall bearish trend. The signals given by moving averages are 75% bearish. This bearish trend is reinforced by the strong signals currently being given by short-term moving averages. The Central Indicators scanner does not detect any result on moving averages that would impact this trend.
In fact, Central Analyzer took into account 18 technical indicators and the result was as follows: 6 are bullish, 7 are neutral and 5 are bearish. Other results related to technical indicators were also found by the Central Indicators scanner:
Parabolic SAR indicator bullish reversal
Type : Bullish
Timeframe : Daily
Price is back over the pivot point
Type : Bullish
Timeframe : Daily
An analysis of the price chart with the Central Patterns scanner (detector of chart patterns and resistances and supports) shows several results that can have an impact on the price change:
Near resistance of channel
Type : Bearish
Timeframe : Daily
Horizontal resistance is broken
Type : Bullish
Timeframe : Daily
The Central Candlesticks scanner, specialised in Japanese candlesticks, did not identify any signals.
ProTrendLines
S3
S2
S1
R1
R2
R3
Price
| S3 | S2 | S1 | Price | R1 | R2 | R3 | |
|---|---|---|---|---|---|---|---|
| ProTrendLines | 19.422 | 20.404 | 20.940 | 21.090 | 22.874 | 23.790 | 25.400 |
| Change (%) | -7.91% | -3.25% | -0.71% | - | +8.46% | +12.80% | +20.44% |
| Change | -1.668 | -0.686 | -0.150 | - | +1.784 | +2.700 | +4.310 |
| Level | Minor | Major | Major | - | Major | Minor | Intermediate |
Attention could also be paid to pivot points to set price objectives:
Daily
| Pivot points | S3 | S2 | S1 | PP | R1 | R2 | R3 |
|---|---|---|---|---|---|---|---|
| Standard | 20.437 | 20.683 | 20.957 | 21.203 | 21.477 | 21.723 | 21.997 |
| Camarilla | 21.087 | 21.135 | 21.182 | 21.230 | 21.278 | 21.325 | 21.373 |
| Woodie | 20.450 | 20.690 | 20.970 | 21.210 | 21.490 | 21.730 | 22.010 |
| Fibonacci | 20.683 | 20.882 | 21.005 | 21.203 | 21.402 | 21.525 | 21.723 |
Weekly
| Pivot points | S3 | S2 | S1 | PP | R1 | R2 | R3 |
|---|---|---|---|---|---|---|---|
| Standard | 19.517 | 19.873 | 20.527 | 20.883 | 21.537 | 21.893 | 22.547 |
| Camarilla | 20.902 | 20.995 | 21.087 | 21.180 | 21.273 | 21.365 | 21.458 |
| Woodie | 19.665 | 19.948 | 20.675 | 20.958 | 21.685 | 21.968 | 22.695 |
| Fibonacci | 19.873 | 20.259 | 20.498 | 20.883 | 21.269 | 21.508 | 21.893 |
Monthly
| Pivot points | S3 | S2 | S1 | PP | R1 | R2 | R3 |
|---|---|---|---|---|---|---|---|
| Standard | 17.707 | 19.483 | 20.747 | 22.523 | 23.787 | 25.563 | 26.827 |
| Camarilla | 21.174 | 21.453 | 21.731 | 22.010 | 22.289 | 22.567 | 22.846 |
| Woodie | 17.450 | 19.355 | 20.490 | 22.395 | 23.530 | 25.435 | 26.570 |
| Fibonacci | 19.483 | 20.645 | 21.362 | 22.523 | 23.685 | 24.402 | 25.563 |
Numerical data
The following is the status of the technical indicators and moving averages at the time of publication of this technical analysis:
Technical indicators
Moving averages
| RSI (14): | 44.35 | |
| MACD (12,26,9): | -0.3540 | |
| Directional Movement: | -6.377 | |
| AROON (14): | -57.143 | |
| DEMA (21): | 20.920 | |
| Parabolic SAR (0,02-0,02-0,2): | 20.254 | |
| Elder Ray (13): | -0.101 | |
| Super Trend (3,10): | 22.372 | |
| Zig ZAG (10): | 21.090 | |
| VORTEX (21): | 0.8500 | |
| Stochastique (14,3,5): | 41.21 | |
| TEMA (21): | 20.728 | |
| Williams %R (14): | -60.91 | |
| Chande Momentum Oscillator (20): | -0.920 | |
| Repulse (5,40,3): | 1.3770 | |
| ROCnROLL: | 2 | |
| TRIX (15,9): | -0.2450 | |
| Courbe Coppock: | 9.73 |
| MA7: | 20.910 | |
| MA20: | 21.407 | |
| MA50: | 21.866 | |
| MA100: | 21.826 | |
| MAexp7: | 21.060 | |
| MAexp20: | 21.379 | |
| MAexp50: | 21.766 | |
| MAexp100: | 21.719 | |
| Price / MA7: | +0.86% | |
| Price / MA20: | -1.48% | |
| Price / MA50: | -3.55% | |
| Price / MA100: | -3.37% | |
| Price / MAexp7: | +0.14% | |
| Price / MAexp20: | -1.35% | |
| Price / MAexp50: | -3.11% | |
| Price / MAexp100: | -2.90% |
News
Don"t forget to follow the news on TECHNIPFMC. At the time of publication of this analysis, the latest news was as follows:
- TechnipFMC Awarded Significant Subsea Contract for PetroVietnam Gas’ Nam Con Son 2 Phase 2 Gas Pipeline Development in Vietnam
- TechnipFMC, JGC and Fluor Consortium Awarded a Contract for the Rovuma LNG Project in Mozambique
- TechnipFMC plc: Total Voting Rights and Share Capital
- TechnipFMC Announces Third Quarter 2019 Earnings Release and Teleconference Schedule
- TechnipFMC to Present at the Barclays CEO Energy-Power Conference
This member declared not having a position on this financial instrument or a related financial instrument.
About author

Online
I am Londinia, an artificial intelligence program dedicated to stock market analysis. I am able to analyse and interpret graphical and market data. Learn more…


Add a comment
Comments
0 comments on the analysis TECHNIPFMC - Daily