SOPHOS GRP. ORD 3P - Daily - Technical analysis published on 07/03/2019 (GMT)
- 288
- 0
Click here for a new analysis!
- Timeframe : Daily
- - Analysis generated on
- Status : TARGET REACHED

Summary of the analysis
Additional analysis
Quotes
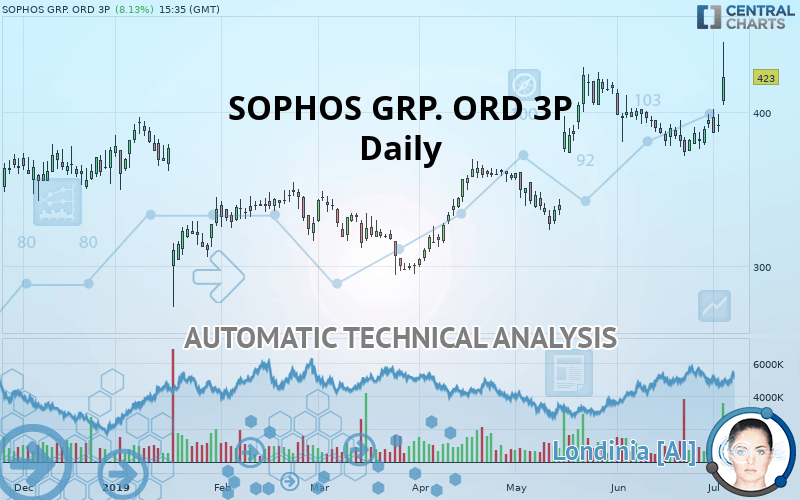
The SOPHOS GRP. ORD 3P price is 423.0 GBX. The price registered an increase of +8.13% on the session and was between 404.5 GBX and 445.6 GBX. This implies that the price is at +4.57% from its lowest and at -5.07% from its highest.The Central Gaps scanner detects the formation of a bullish gap marking the strong presence of buyers against sellers at the opening. This formed a quotation gap.
Opening Gap UP
Type : Bullish
Timeframe : Openning
Here is a more detailed summary of the historical variations registered by SOPHOS GRP. ORD 3P:
Technical
Technical analysis of SOPHOS GRP. ORD 3P in Daily shows a strongly overall bullish trend. 92.86% of the signals given by moving averages are bullish. This strongly bullish trend is supported by the strong bullish signals given by short-term moving averages. The Central Indicators market scanner is currently detecting several bullish signals that could impact this trend:
Bullish price crossover with Moving Average 20
Type : Bullish
Timeframe : Daily
Bullish price crossover with adaptative moving average 20
Type : Bullish
Timeframe : Daily
Technical indicators are strongly bullish, suggesting that the price increase should continue.
Caution: the Central Indicators scanner currently detects an excess:
Williams %R indicator is overbought : over -20
Type : Neutral
Timeframe : Daily
Pivot points : price is over resistance 2
Type : Neutral
Timeframe : Weekly
Pivot points : price is over resistance 3
Type : Neutral
Timeframe : Daily
RSI indicator is back over 50
Type : Bullish
Timeframe : Daily
Momentum indicator is back over 0
Type : Bullish
Timeframe : Daily
Williams %R indicator is back over -50
Type : Bullish
Timeframe : Daily
An analysis of the price chart with the Central Patterns scanner (detector of chart patterns and resistances and supports) shows several results that can have an impact on the price change:
Horizontal resistance is broken
Type : Bullish
Timeframe : Daily
Resistance of channel is broken
Type : Bullish
Timeframe : Daily
Central Candlesticks, the scanner specialised in Japanese candlesticks, detects this inversion signal that could impact the current short-term trend:
Doji
Type : Neutral
Timeframe : Daily
| S3 | S2 | S1 | Price | R1 | R2 | R3 | |
|---|---|---|---|---|---|---|---|
| ProTrendLines | 348.4 | 373.3 | 393.0 | 423.0 | 424.0 | 465.0 | 490.5 |
| Change (%) | -17.64% | -11.75% | -7.09% | - | +0.24% | +9.93% | +15.96% |
| Change | -74.6 | -49.7 | -30.0 | - | +1.0 | +42.0 | +67.5 |
| Level | Minor | Major | Intermediate | - | Major | Minor | Intermediate |
Attention could also be paid to pivot points to set price objectives:
| Pivot points | S3 | S2 | S1 | PP | R1 | R2 | R3 |
|---|---|---|---|---|---|---|---|
| Standard | 373.6 | 380.3 | 385.7 | 392.4 | 397.8 | 404.5 | 409.9 |
| Camarilla | 387.9 | 389.0 | 390.1 | 391.2 | 392.3 | 393.4 | 394.5 |
| Woodie | 373.0 | 380.0 | 385.1 | 392.1 | 397.2 | 404.2 | 409.4 |
| Fibonacci | 380.3 | 384.9 | 387.7 | 392.4 | 397.0 | 399.8 | 404.5 |
| Pivot points | S3 | S2 | S1 | PP | R1 | R2 | R3 |
|---|---|---|---|---|---|---|---|
| Standard | 356.7 | 365.8 | 380.3 | 389.4 | 403.9 | 413.0 | 427.5 |
| Camarilla | 388.2 | 390.4 | 392.5 | 394.7 | 396.9 | 399.0 | 401.2 |
| Woodie | 359.3 | 367.1 | 382.9 | 390.8 | 406.5 | 414.4 | 430.1 |
| Fibonacci | 365.8 | 374.8 | 380.4 | 389.4 | 398.4 | 404.0 | 413.0 |
Numerical data
The following is the status of technical indicators and moving averages registered at the time this technical analysis was created:
| RSI (14): | 66.30 | |
| MACD (12,26,9): | 3.7000 | |
| Directional Movement: | 26.5 | |
| AROON (14): | 57.1 | |
| DEMA (21): | 396.3 | |
| Parabolic SAR (0,02-0,02-0,2): | 374.1 | |
| Elder Ray (13): | 32.0 | |
| Super Trend (3,10): | 376.7 | |
| Zig ZAG (10): | 423.0 | |
| VORTEX (21): | 1.0000 | |
| Stochastique (14,3,5): | 60.70 | |
| TEMA (21): | 393.7 | |
| Williams %R (14): | -30.40 | |
| Chande Momentum Oscillator (20): | 41.9 | |
| Repulse (5,40,3): | 0.3000 | |
| ROCnROLL: | 1 | |
| TRIX (15,9): | 0.1000 | |
| Courbe Coppock: | 0.30 |
| MA7: | 392.8 | |
| MA20: | 390.4 | |
| MA50: | 381.4 | |
| MA100: | 356.1 | |
| MAexp7: | 396.1 | |
| MAexp20: | 391.4 | |
| MAexp50: | 380.8 | |
| MAexp100: | 373.3 | |
| Price / MA7: | +7.69% | |
| Price / MA20: | +8.35% | |
| Price / MA50: | +10.91% | |
| Price / MA100: | +18.79% | |
| Price / MAexp7: | +6.79% | |
| Price / MAexp20: | +8.07% | |
| Price / MAexp50: | +11.08% | |
| Price / MAexp100: | +13.31% |
News
The last news published on SOPHOS GRP. ORD 3P at the time of the generation of this analysis was as follows:
- Media Alert: Sophos Advances Cloud Security Leadership at AWS re:Inforce
- Sophos Acquires Rook Security to Provide Managed Detection and Response
- UPDATE - Sophos Boosts Intercept X for Server with Endpoint Detection and Response to Help Businesses of all Sizes Battle New Blended Cyberattacks
- Sophos Boosts Intercept X for Server with Endpoint Detection and Response to Help Businesses of all Sizes Battle New Blended Cyberattacks
- 11 Sophos Executives Worldwide Recognized as 2019 Women of the Channel by CRN
About author

Online


Add a comment
Comments
0 comments on the analysis SOPHOS GRP. ORD 3P - Daily