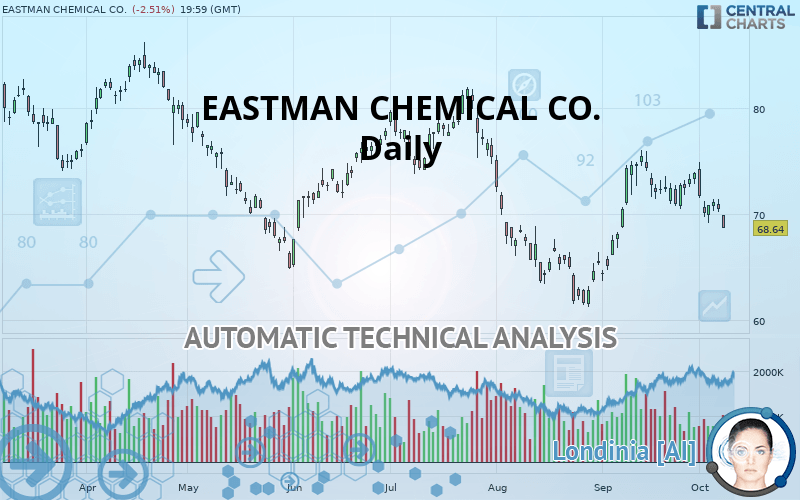
EASTMAN CHEMICAL CO. - Daily - Technical analysis published on 10/08/2019 (GMT)
- Who voted?
- 257
- 0
Click here for a new analysis!
- Timeframe : Daily
- - Analysis generated on
- Status : INVALID

Summary of the analysis

Additional analysis
Quotes
The EASTMAN CHEMICAL CO. price is 68.64 USD. The price is lower by -2.51% since the last closing with the lowest point at 68.64 USD and the highest point at 69.84 USD. The deviation from the price is 0% for the low point and -1.72% for the high point.The Central Gaps scanner detects the formation of a bearish gap marking the strong presence of sellers ahead of buyers at the opening. This formed a quotation gap.
Opening Gap DOWN
Type : Bearish
Timeframe : Openning
So that you have an overall view of the price change, here is a table showing the variations over several periods:
Near a new LOW record (1 month)
Type : Bearish
Timeframe : Weekly
Technical
Technical analysis of this Daily chart of EASTMAN CHEMICAL CO. indicates that the overall trend is strongly bearish. The signals given by moving averages are 82.14% bearish. This strong bearish trend is confirmed by the strong signals currently being given by short-term moving averages. An assessment of moving averages reveals several bearish signals that could impact this trend:
Bearish trend reversal : adaptative moving average 50
Type : Bearish
Timeframe : Daily
Bearish price crossover with adaptative moving average 20
Type : Bearish
Timeframe : Daily
Bearish price crossover with adaptative moving average 50
Type : Bearish
Timeframe : Daily
The probability of a further decline is low given the direction of the technical indicators.
Caution: the Central Indicators scanner currently detects an excess:
CCI indicator is oversold : under -100
Type : Neutral
Timeframe : Daily
Pivot points : price is under support 3
Type : Neutral
Timeframe : Daily
RSI indicator is back under 50
Type : Bearish
Timeframe : Daily
Price is back under the pivot point
Type : Bearish
Timeframe : Weekly
Central Patterns, the market scanner focusing on chart patterns, resistances and supports found this result:
Support of channel is broken
Type : Bearish
Timeframe : Daily
The Central Candlesticks scanner, specialised in Japanese candlesticks, did not identify any signals.
| S3 | S2 | S1 | Price | R1 | R2 | R3 | |
|---|---|---|---|---|---|---|---|
| ProTrendLines | 61.55 | 64.83 | 68.45 | 68.64 | 70.89 | 74.29 | 78.21 |
| Change (%) | -10.33% | -5.55% | -0.28% | - | +3.28% | +8.23% | +13.94% |
| Change | -7.09 | -3.81 | -0.19 | - | +2.25 | +5.65 | +9.57 |
| Level | Major | Major | Intermediate | - | Intermediate | Major | Major |
To determine price objectives, it is also possible to use the pivot points. Here is the price position in relation to pivot points:
| Pivot points | S3 | S2 | S1 | PP | R1 | R2 | R3 |
|---|---|---|---|---|---|---|---|
| Standard | 68.59 | 69.36 | 69.89 | 70.66 | 71.18 | 71.95 | 72.48 |
| Camarilla | 70.05 | 70.17 | 70.29 | 70.41 | 70.53 | 70.65 | 70.77 |
| Woodie | 68.47 | 69.30 | 69.76 | 70.59 | 71.06 | 71.89 | 72.35 |
| Fibonacci | 69.36 | 69.86 | 70.16 | 70.66 | 71.15 | 71.46 | 71.95 |
| Pivot points | S3 | S2 | S1 | PP | R1 | R2 | R3 |
|---|---|---|---|---|---|---|---|
| Standard | 62.78 | 65.95 | 68.51 | 71.68 | 74.24 | 77.41 | 79.97 |
| Camarilla | 69.49 | 70.02 | 70.55 | 71.07 | 71.60 | 72.12 | 72.65 |
| Woodie | 62.47 | 65.80 | 68.20 | 71.53 | 73.94 | 77.26 | 79.67 |
| Fibonacci | 65.95 | 68.14 | 69.49 | 71.68 | 73.87 | 75.22 | 77.41 |
| Pivot points | S3 | S2 | S1 | PP | R1 | R2 | R3 |
|---|---|---|---|---|---|---|---|
| Standard | 53.10 | 58.11 | 65.97 | 70.98 | 78.84 | 83.85 | 91.71 |
| Camarilla | 70.29 | 71.47 | 72.65 | 73.83 | 75.01 | 76.19 | 77.37 |
| Woodie | 54.53 | 58.82 | 67.40 | 71.69 | 80.26 | 84.56 | 93.13 |
| Fibonacci | 58.11 | 63.03 | 66.07 | 70.98 | 75.90 | 78.93 | 83.85 |
Numerical data
The following is the status of the technical indicators and moving averages at the time of publication of this technical analysis:
| RSI (14): | 42.45 | |
| MACD (12,26,9): | 0.2600 | |
| Directional Movement: | -9.74 | |
| AROON (14): | -35.71 | |
| DEMA (21): | 71.50 | |
| Parabolic SAR (0,02-0,02-0,2): | 73.58 | |
| Elder Ray (13): | -1.79 | |
| Super Trend (3,10): | 68.37 | |
| Zig ZAG (10): | 68.64 | |
| VORTEX (21): | 0.9900 | |
| Stochastique (14,3,5): | 18.84 | |
| TEMA (21): | 71.46 | |
| Williams %R (14): | -100.00 | |
| Chande Momentum Oscillator (20): | -3.69 | |
| Repulse (5,40,3): | -2.7200 | |
| ROCnROLL: | 2 | |
| TRIX (15,9): | 0.2000 | |
| Courbe Coppock: | 5.85 |
| MA7: | 70.94 | |
| MA20: | 72.28 | |
| MA50: | 68.79 | |
| MA100: | 71.17 | |
| MAexp7: | 70.59 | |
| MAexp20: | 70.92 | |
| MAexp50: | 70.66 | |
| MAexp100: | 71.75 | |
| Price / MA7: | -3.24% | |
| Price / MA20: | -5.04% | |
| Price / MA50: | -0.22% | |
| Price / MA100: | -3.55% | |
| Price / MAexp7: | -2.76% | |
| Price / MAexp20: | -3.21% | |
| Price / MAexp50: | -2.86% | |
| Price / MAexp100: | -4.33% |
News
Don"t forget to follow the news on EASTMAN CHEMICAL CO.. At the time of publication of this analysis, the latest news was as follows:
- Eastman Schedules Third-Quarter 2019 Financial Results News Release and SEC Form 8-K Filing, Teleconference and Webcast
- Eastman Kodak Adopts Tax Asset Protection Plan; Files Certificate of Amendment With Respect to Charter Amendment Designed to Protect Tax Assets
- Kodak Reports Second-Quarter Revenue of $307 Million and Continued Growth in Key Product Lines
- Eastman Publishes 2019 Sustainability Report: Innovating. Accelerating. Enhancing.
- Eastman Board Declares Dividend
About author

Online


Add a comment
Comments
0 comments on the analysis EASTMAN CHEMICAL CO. - Daily