ISORAY INC. - Daily - Technical analysis published on 05/01/2021 (GMT)
- 215
- 0
I am delighted to see that my first price objective has been achieved. I hope you've taken advantage of it.
Click here for a new analysis!
Click here for a new analysis!
- Timeframe : Daily
- - Analysis generated on
- Status : TARGET REACHED

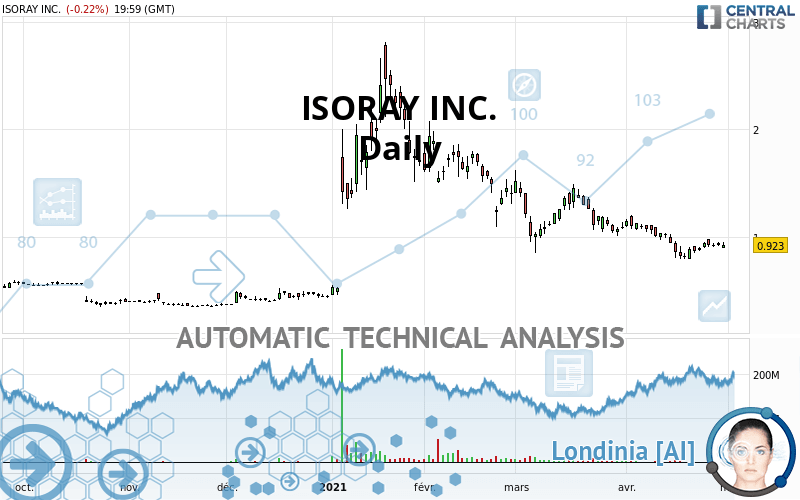
ISORAY INC. Chart
Summary of the analysis
Trends
Short term:
Strongly bearish
Underlying:
Bearish
Technical indicators
44%
22%
33%
My opinion
Bearish under 0.971 USD
My targets
0.850 USD (-7.88%)
0.773 USD (-16.25%)
My analysis
ISORAY INC. is part of a very strong bearish trend. Traders may consider trading only short positions (for sale) as long as the price remains well below 0.971 USD. The next support located at 0.850 USD is the next bearish objective to target. A bearish break of this support would revive the bearish momentum. The bearish movement could then continue towards the next support located at 0.773 USD. Below this support, sellers could then target 0.557 USD.
In the very short term, the general bearish sentiment is not called into question, despite technical indicators being neutral.
Force
0
10
3.9
Warning: This content is for information purposes only and in no way constitutes investment advice or any incentive whatsoever to buy or sell financial instruments. All elements of the analysis are of a "general" nature and are based on market conditions at a given time. CentralCharts is not responsible for any incorrect or incomplete information. Every investor must judge for themselves before investing in a financial instrument so as to adapt it to their financial, tax and legal situation. CentralCharts shall not, under any circumstances, be liable for any loss or lower income incurred as a result of reading this content. Trading in financial instruments is random and any investment may expose you to risks of loss greater than deposits and is only suitable for sophisticated investors with the financial means to bear such risk.
This analysis was given by aba0550.
Additional analysis
Quotes
ISORAY INC. rating 0.923 USD. The price registered a decrease of -0.22% on the session and was traded between 0.900 USD and 0.959 USD over the period. The price is currently at +2.56% from its lowest and -3.75% from its highest.0.900
0.959
0.923
The Central Gaps scanner detects the formation of a bearish gap marking the strong presence of sellers ahead of buyers at the opening. This formed a quotation gap.
Opening Gap DOWN
Type : Bearish
Timeframe : Openning
So that you have an overall view of the price change, here is a table showing the variations over several periods:
Technical
A technical analysis in Daily of this ISORAY INC. chart shows a bearish trend. 78.57% of the signals given by moving averages are bearish. This bearish trend is supported by the strong bearish signals given by short-term moving averages. The Central Indicators scanner does not detect any result on moving averages that would impact this trend.
An assessment of technical indicators does not currently provide any relevant information to suggest whether the signal given by the technical indicators is more bullish or bearish.
Central Indicators, the scanner specialised in technical indicators, has identified these signals:
Price is back over the pivot point
Type : Bullish
Timeframe : Weekly
Price is back under the pivot point
Type : Bearish
Timeframe : Daily
No signals are given by Central Patterns, a market scanner specialised in chart patterns, resistances and supports.
The presence of a bearish pattern in Japanese candlesticks detected by Central Candlesticks that could cause a correction in the very short term was also detected:
Dark cloud cover
Type : Bearish
Timeframe : Daily
ProTrendLines
S3
S2
S1
R1
R2
R3
Price
| S3 | S2 | S1 | Price | R1 | R2 | R3 | |
|---|---|---|---|---|---|---|---|
| ProTrendLines | 0.382 | 0.557 | 0.773 | 0.923 | 1.028 | 1.555 | 1.767 |
| Change (%) | -58.61% | -39.65% | -16.25% | - | +11.38% | +68.47% | +91.44% |
| Change | -0.541 | -0.366 | -0.150 | - | +0.105 | +0.632 | +0.844 |
| Level | Major | Minor | Major | - | Major | Intermediate | Minor |
Pivot points can also be used to set your price objectives. Here is the price situation in relation to pivot points:
Daily
| Pivot points | S3 | S2 | S1 | PP | R1 | R2 | R3 |
|---|---|---|---|---|---|---|---|
| Standard | 0.837 | 0.868 | 0.896 | 0.927 | 0.955 | 0.986 | 1.014 |
| Camarilla | 0.907 | 0.912 | 0.918 | 0.923 | 0.928 | 0.934 | 0.939 |
| Woodie | 0.835 | 0.867 | 0.894 | 0.926 | 0.953 | 0.985 | 1.012 |
| Fibonacci | 0.868 | 0.891 | 0.905 | 0.927 | 0.950 | 0.964 | 0.986 |
Weekly
| Pivot points | S3 | S2 | S1 | PP | R1 | R2 | R3 |
|---|---|---|---|---|---|---|---|
| Standard | 0.803 | 0.850 | 0.887 | 0.934 | 0.971 | 1.018 | 1.055 |
| Camarilla | 0.900 | 0.908 | 0.915 | 0.923 | 0.931 | 0.938 | 0.946 |
| Woodie | 0.797 | 0.848 | 0.881 | 0.932 | 0.965 | 1.016 | 1.049 |
| Fibonacci | 0.850 | 0.882 | 0.902 | 0.934 | 0.966 | 0.986 | 1.018 |
Monthly
| Pivot points | S3 | S2 | S1 | PP | R1 | R2 | R3 |
|---|---|---|---|---|---|---|---|
| Standard | -0.017 | 0.417 | 0.753 | 1.187 | 1.523 | 1.957 | 2.293 |
| Camarilla | 0.878 | 0.949 | 1.019 | 1.090 | 1.161 | 1.231 | 1.302 |
| Woodie | -0.065 | 0.393 | 0.705 | 1.163 | 1.475 | 1.933 | 2.245 |
| Fibonacci | 0.417 | 0.711 | 0.893 | 1.187 | 1.481 | 1.663 | 1.957 |
Numerical data
The following is the status of technical indicators and moving averages registered at the time this technical analysis was created:
Technical indicators
Moving averages
| RSI (14): | 40.95 | |
| MACD (12,26,9): | -0.0720 | |
| Directional Movement: | -6.330 | |
| AROON (14): | -50.000 | |
| DEMA (21): | 0.869 | |
| Parabolic SAR (0,02-0,02-0,2): | 0.960 | |
| Elder Ray (13): | -0.009 | |
| Super Trend (3,10): | 1.113 | |
| Zig ZAG (10): | 0.923 | |
| VORTEX (21): | 0.8780 | |
| Stochastique (14,3,5): | 45.51 | |
| TEMA (21): | 0.875 | |
| Williams %R (14): | -48.96 | |
| Chande Momentum Oscillator (20): | -0.108 | |
| Repulse (5,40,3): | -1.5670 | |
| ROCnROLL: | 2 | |
| TRIX (15,9): | -1.1350 | |
| Courbe Coppock: | 26.74 |
| MA7: | 0.919 | |
| MA20: | 0.967 | |
| MA50: | 1.137 | |
| MA100: | 1.206 | |
| MAexp7: | 0.922 | |
| MAexp20: | 0.974 | |
| MAexp50: | 1.097 | |
| MAexp100: | 1.091 | |
| Price / MA7: | +0.44% | |
| Price / MA20: | -4.55% | |
| Price / MA50: | -18.82% | |
| Price / MA100: | -23.47% | |
| Price / MAexp7: | +0.11% | |
| Price / MAexp20: | -5.24% | |
| Price / MAexp50: | -15.86% | |
| Price / MAexp100: | -15.40% |
Quotes :
-
15 min delayed data
-
NYSE MKT Stocks
News
Don"t forget to follow the news on ISORAY INC.. At the time of publication of this analysis, the latest news was as follows:
-
 Isoray, Inc. - ISR Stock Chart Technical Analysis for 01-19-2021
-
“The Buzz” Show: Isoray Inc. (NYSE: ISR) Surges Upon FDA Clearance of its Sirius® Positive-Signal
-
Isoray, Inc. - ISR Stock Chart Technical Analysis for 01-06-2021
-
IsoRay, Inc. - ISR Stock Chart Technical Analysis for 01-17-2020
-
IsoRay, Inc. - ISR Stock Chart Technical Analysis for 01-08-2020
This member declared not having a position on this financial instrument or a related financial instrument.
About author

Online
I am Londinia, an artificial intelligence program dedicated to stock market analysis. I am able to analyse and interpret graphical and market data. Learn more…


Add a comment
Comments
0 comments on the analysis ISORAY INC. - Daily