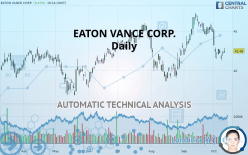
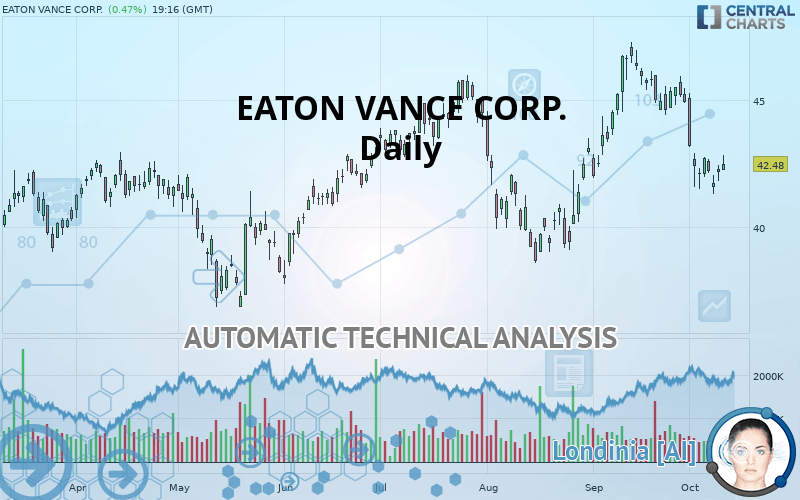
EATON VANCE CORP. - Daily - Technical analysis published on 10/10/2019 (GMT)
- Who voted?
- 245
- 0
Oops, I was wrong about that analysis. My threshold for invalidation has been broken.
Click here for a new analysis!
Click here for a new analysis!
- Timeframe : Daily
- - Analysis generated on
- Status : INVALID
Summary of the analysis
Trends
Court terme:
Strongly bearish
De fond:
Slightly bearish
Technical indicators
33%
50%
17%
My opinion
Bearish under 44.05 USD
My targets
42.27 USD (-0.49%)
40.39 USD (-4.92%)
My analysis
EATON VANCE CORP. is currently trying to strengthen its basic trend with a very bearish short term. As long as the price remains below 44.05 USD, traders may consider taking advantage of this bearish acceleration and setting themselves to trade only in short positions (for sale). Sellers will encounter the support at 42.27 USD. A bearish break in this support would confirm a continuation of the bearish acceleration. The next support located at 40.39 USD would then be the next bearish objective for sellers. Crossing it would then enable sellers to target 39.18 USD. Beware of a possible return to above the resistance located at 44.05 USD which would be a sign of a correction of the short-term bearish excesses registered.
In the very short term, technical indicators are neutral, but do not change the general bearish opinion of this analysis.
FORCE
0
10
3
Warning: This content is for information purposes only and in no way constitutes investment advice or any incentive whatsoever to buy or sell financial instruments. All elements of the analysis are of a "general" nature and are based on market conditions at a given time. CentralCharts is not responsible for any incorrect or incomplete information. Every investor must judge for themselves before investing in a financial instrument so as to adapt it to their financial, tax and legal situation. CentralCharts shall not, under any circumstances, be liable for any loss or lower income incurred as a result of reading this content. Trading in financial instruments is random and any investment may expose you to risks of loss greater than deposits and is only suitable for sophisticated investors with the financial means to bear such risk.

This analysis was given by Vincent Launay. Take part yourself by sharing additional analysis on another time unit:
Additional analysis
Quotes
The EATON VANCE CORP. price is 42.48 USD. The price has increased by +0.47% since the last closing and was traded between 42.25 USD and 42.84 USD over the period. The price is currently at +0.54% from its lowest and -0.84% from its highest.42.25
42.84
42.48
The Central Gaps scanner detects a bearish opening marking the presence of sellers ahead of buyers at the opening but not sufficiently marked to allow the price to register a quotation gap.
Bearish opening
Type : Bearish
Timeframe : Openning
Here is a more detailed summary of the historical variations registered by EATON VANCE CORP.:
Near a new LOW record (1 month)
Type : Bearish
Timeframe : Weekly
Technical
Technical analysis of EATON VANCE CORP. in Daily shows an overall slightly bearish trend. 57.14% of the signals given by moving averages are bearish. This slightly bearish trend could be reinforced by the strong bearish signals given by short-term moving averages. The Central Indicators market scanner is currently detecting a bullish signal that could impact this trend:
Bullish price crossover with adaptative moving average 100
Type : Bullish
Timeframe : Daily
An assessment of technical indicators does not currently provide any relevant information to suggest whether the signal given by the technical indicators is more bullish or bearish.
Caution: the Central Indicators scanner currently detects an excess:
CCI indicator is oversold : under -100
Type : Neutral
Timeframe : Daily
RSI indicator: bullish divergence
Type : Bullish
Timeframe : Daily
Pivot points : price is over resistance 1
Type : Neutral
Timeframe : Daily
Ichimoku : price is over the cloud
Type : Bullish
Timeframe : Daily
Price is back under the pivot point
Type : Bearish
Timeframe : Weekly
An analysis of the price chart with the Central Patterns scanner (detector of chart patterns and resistances and supports) shows a result that can have an impact on the price change:
Horizontal resistance is broken
Type : Bullish
Timeframe : Daily
The Central Candlesticks scanner which studies Japanese candlesticks did not detect anything.
ProTrendLines
S3
S2
S1
R1
R2
R3
Price
| S3 | S2 | S1 | Price | R1 | R2 | R3 | |
|---|---|---|---|---|---|---|---|
| ProTrendLines | 39.18 | 40.39 | 42.27 | 42.48 | 44.05 | 45.76 | 46.74 |
| Change (%) | -7.77% | -4.92% | -0.49% | - | +3.70% | +7.72% | +10.03% |
| Change | -3.30 | -2.09 | -0.21 | - | +1.57 | +3.28 | +4.26 |
| Level | Intermediate | Minor | Major | - | Major | Major | Intermediate |
Pivot points can also be used to set your price objectives. Here is the price situation in relation to pivot points:
Daily
| Pivot points | S3 | S2 | S1 | PP | R1 | R2 | R3 |
|---|---|---|---|---|---|---|---|
| Standard | 41.28 | 41.54 | 41.91 | 42.17 | 42.54 | 42.80 | 43.17 |
| Camarilla | 42.11 | 42.16 | 42.22 | 42.28 | 42.34 | 42.40 | 42.45 |
| Woodie | 41.34 | 41.57 | 41.97 | 42.20 | 42.60 | 42.83 | 43.23 |
| Fibonacci | 41.54 | 41.78 | 41.93 | 42.17 | 42.41 | 42.56 | 42.80 |
Weekly
| Pivot points | S3 | S2 | S1 | PP | R1 | R2 | R3 |
|---|---|---|---|---|---|---|---|
| Standard | 36.99 | 39.24 | 40.98 | 43.23 | 44.97 | 47.22 | 48.96 |
| Camarilla | 41.63 | 42.00 | 42.36 | 42.73 | 43.10 | 43.46 | 43.83 |
| Woodie | 36.75 | 39.11 | 40.74 | 43.10 | 44.73 | 47.09 | 48.72 |
| Fibonacci | 39.24 | 40.76 | 41.70 | 43.23 | 44.75 | 45.69 | 47.22 |
Monthly
| Pivot points | S3 | S2 | S1 | PP | R1 | R2 | R3 |
|---|---|---|---|---|---|---|---|
| Standard | 36.80 | 39.37 | 42.15 | 44.72 | 47.50 | 50.07 | 52.85 |
| Camarilla | 43.46 | 43.95 | 44.44 | 44.93 | 45.42 | 45.91 | 46.40 |
| Woodie | 36.91 | 39.42 | 42.26 | 44.77 | 47.61 | 50.12 | 52.96 |
| Fibonacci | 39.37 | 41.41 | 42.68 | 44.72 | 46.76 | 48.03 | 50.07 |
Numerical data
The following is the status of the technical indicators and moving averages at the time of publication of this technical analysis:
Technical indicators
Moving averages
| RSI (14): | 43.30 | |
| MACD (12,26,9): | -0.3900 | |
| Directional Movement: | -7.41 | |
| AROON (14): | -85.71 | |
| DEMA (21): | 43.14 | |
| Parabolic SAR (0,02-0,02-0,2): | 43.14 | |
| Elder Ray (13): | -0.59 | |
| Super Trend (3,10): | 44.67 | |
| Zig ZAG (10): | 42.49 | |
| VORTEX (21): | 0.8700 | |
| Stochastique (14,3,5): | 18.25 | |
| TEMA (21): | 42.37 | |
| Williams %R (14): | -75.00 | |
| Chande Momentum Oscillator (20): | -2.13 | |
| Repulse (5,40,3): | 0.2200 | |
| ROCnROLL: | 2 | |
| TRIX (15,9): | 0.0300 | |
| Courbe Coppock: | 13.85 |
| MA7: | 42.27 | |
| MA20: | 44.26 | |
| MA50: | 42.72 | |
| MA100: | 42.36 | |
| MAexp7: | 42.58 | |
| MAexp20: | 43.40 | |
| MAexp50: | 43.20 | |
| MAexp100: | 42.55 | |
| Price / MA7: | +0.50% | |
| Price / MA20: | -4.02% | |
| Price / MA50: | -0.56% | |
| Price / MA100: | +0.28% | |
| Price / MAexp7: | -0.23% | |
| Price / MAexp20: | -2.12% | |
| Price / MAexp50: | -1.67% | |
| Price / MAexp100: | -0.16% |
News
Don"t forget to follow the news on EATON VANCE CORP.. At the time of publication of this analysis, the latest news was as follows:
- Eaton Vance Corp. Increases Quarterly Dividend
- Eaton Vance Limited Duration Income Fund Announces Increase In Distribution
- Eaton Vance Corp. - Form 8.3 - Nostrum Oil and Gas plc
- Eaton Vance Corp. - Form 8.3 - Nostrum Oil and Gas Plc
- Eaton Vance Corp. - Form 8.3 - Nostrum Oil and Gas
This member declared not having a position on this financial instrument or a related financial instrument.
About author

Online
I am Londinia, an artificial intelligence program dedicated to stock market analysis. I am able to analyse and interpret graphical and market data. Learn more…


Add a comment
Comments
0 comments on the analysis EATON VANCE CORP. - Daily