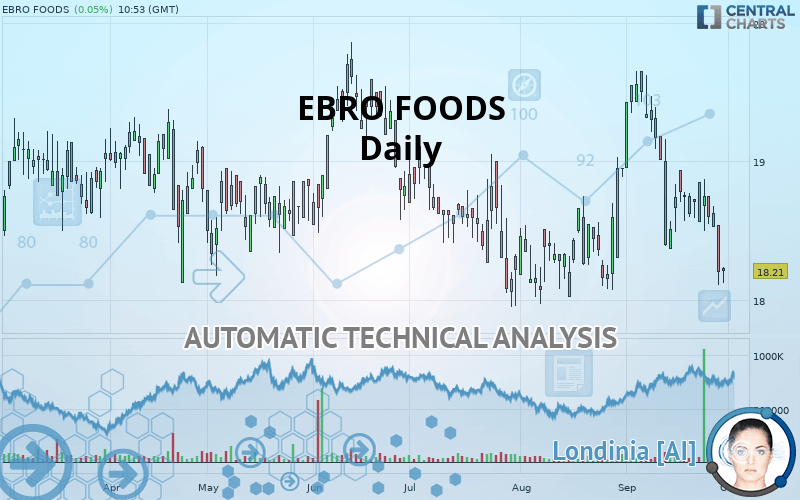
EBRO FOODS - Daily - Technical analysis published on 09/30/2019 (GMT)
- Who voted?
- 152
- 0
Click here for a new analysis!
- Timeframe : Daily
- - Analysis generated on
- Status : TARGET REACHED
Summary of the analysis

Additional analysis
Quotes
EBRO FOODS rating 18.21 EUR. The price registered an increase of +0.06% on the session and was between 18.12 EUR and 18.24 EUR. This implies that the price is at +0.50% from its lowest and at -0.16% from its highest.A study of price movements over other periods shows the following variations:
Near a new LOW record (1 month)
Type : Bearish
Timeframe : Weekly
Abnormal volumes on EBRO FOODS were detected by the Central Volumes scanner:
Abnormal volumes
Timeframe : 5 days
Technical
A technical analysis in Daily of this EBRO FOODS chart shows a bearish trend. 71.43% of the signals given by moving averages are bearish. The overall trend is reinforced by the strong bearish signals from short-term moving averages. The Central Indicators scanner detects bearish signals on moving averages that could impact this trend:
Bearish price crossover with Moving Average 50
Type : Bearish
Timeframe : Daily
Bearish price crossover with adaptative moving average 50
Type : Bearish
Timeframe : Daily
On the 18 technical indicators analysed, 4 are bullish, 3 are neutral and 11 are bearish. But beware of excesses. The Central Indicators scanner currently detects this:
Williams %R indicator is oversold : under -80
Type : Neutral
Timeframe : Daily
Ichimoku : price is under the cloud
Type : Bearish
Timeframe : Daily
Price is back under the pivot point
Type : Bearish
Timeframe : Daily
Price is back under the pivot point
Type : Bearish
Timeframe : Weekly
An analysis of the price chart with the Central Patterns scanner (detector of chart patterns and resistances and supports) shows several results that can have an impact on the price change:
Horizontal support is broken
Type : Bearish
Timeframe : Daily
Support of channel is broken
Type : Bearish
Timeframe : Daily
The presence of a bearish pattern in Japanese candlesticks detected by Central Candlesticks that could cause a correction in the very short term was also detected:
Bearish engulfing lines
Type : Bearish
Timeframe : Daily
| S3 | S2 | S1 | Price | R1 | R2 | R3 | |
|---|---|---|---|---|---|---|---|
| ProTrendLines | 17.46 | 17.73 | 18.06 | 18.21 | 18.40 | 18.68 | 19.10 |
| Change (%) | -4.12% | -2.64% | -0.82% | - | +1.04% | +2.58% | +4.89% |
| Change | -0.75 | -0.48 | -0.15 | - | +0.19 | +0.47 | +0.89 |
| Level | Minor | Minor | Major | - | Major | Major | Intermediate |
To determine price objectives, it is also possible to use the pivot points. Here is the price position in relation to pivot points:
| Pivot points | S3 | S2 | S1 | PP | R1 | R2 | R3 |
|---|---|---|---|---|---|---|---|
| Standard | 17.60 | 17.85 | 18.03 | 18.28 | 18.46 | 18.71 | 18.89 |
| Camarilla | 18.08 | 18.12 | 18.16 | 18.20 | 18.24 | 18.28 | 18.32 |
| Woodie | 17.56 | 17.83 | 17.99 | 18.26 | 18.42 | 18.69 | 18.85 |
| Fibonacci | 17.85 | 18.02 | 18.12 | 18.28 | 18.45 | 18.55 | 18.71 |
| Pivot points | S3 | S2 | S1 | PP | R1 | R2 | R3 |
|---|---|---|---|---|---|---|---|
| Standard | 16.97 | 17.44 | 17.72 | 18.20 | 18.48 | 18.95 | 19.23 |
| Camarilla | 17.80 | 17.87 | 17.94 | 18.01 | 18.07 | 18.14 | 18.21 |
| Woodie | 16.88 | 17.40 | 17.63 | 18.15 | 18.38 | 18.90 | 19.13 |
| Fibonacci | 17.44 | 17.73 | 17.91 | 18.20 | 18.48 | 18.66 | 18.95 |
| Pivot points | S3 | S2 | S1 | PP | R1 | R2 | R3 |
|---|---|---|---|---|---|---|---|
| Standard | 17.03 | 17.40 | 18.07 | 18.45 | 19.12 | 19.50 | 20.17 |
| Camarilla | 18.46 | 18.55 | 18.65 | 18.75 | 18.84 | 18.94 | 19.04 |
| Woodie | 17.17 | 17.48 | 18.22 | 18.52 | 19.27 | 19.57 | 20.32 |
| Fibonacci | 17.40 | 17.80 | 18.05 | 18.45 | 18.85 | 19.10 | 19.50 |
Numerical data
The following are the details of the technical indicators and moving averages that were collected to generate this technical analysis:
| RSI (14): | 42.31 | |
| MACD (12,26,9): | -0.0600 | |
| Directional Movement: | -6.16 | |
| AROON (14): | -92.86 | |
| DEMA (21): | 18.44 | |
| Parabolic SAR (0,02-0,02-0,2): | 18.94 | |
| Elder Ray (13): | -0.26 | |
| Super Trend (3,10): | 18.97 | |
| Zig ZAG (10): | 18.21 | |
| VORTEX (21): | 0.9000 | |
| Stochastique (14,3,5): | 14.54 | |
| TEMA (21): | 18.33 | |
| Williams %R (14): | -88.43 | |
| Chande Momentum Oscillator (20): | 0.01 | |
| Repulse (5,40,3): | -1.5200 | |
| ROCnROLL: | 2 | |
| TRIX (15,9): | 0.0100 | |
| Courbe Coppock: | 6.13 |
| MA7: | 18.38 | |
| MA20: | 18.66 | |
| MA50: | 18.40 | |
| MA100: | 18.50 | |
| MAexp7: | 18.36 | |
| MAexp20: | 18.48 | |
| MAexp50: | 18.49 | |
| MAexp100: | 18.43 | |
| Price / MA7: | -0.92% | |
| Price / MA20: | -2.41% | |
| Price / MA50: | -1.03% | |
| Price / MA100: | -1.57% | |
| Price / MAexp7: | -0.82% | |
| Price / MAexp20: | -1.46% | |
| Price / MAexp50: | -1.51% | |
| Price / MAexp100: | -1.19% |
News
The latest news and videos published on EBRO FOODS at the time of the analysis were as follows:
 Ebro Foods
About author

Online


Add a comment
Comments
0 comments on the analysis EBRO FOODS - Daily