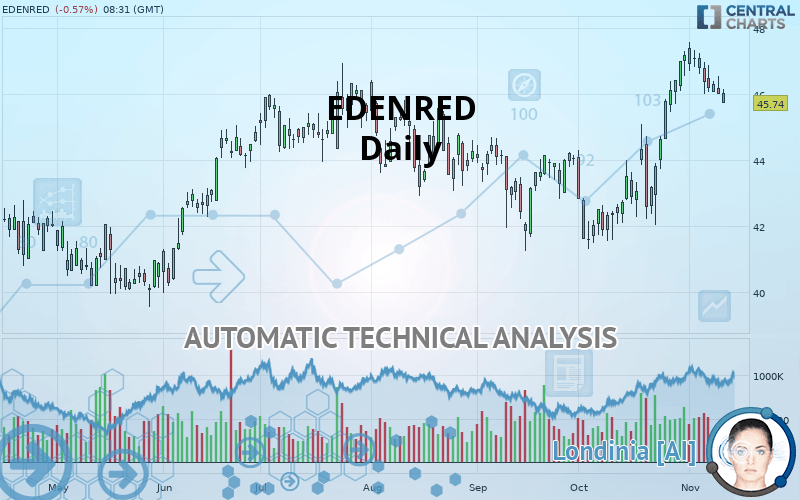
EDENRED - Daily - Technical analysis published on 11/12/2019 (GMT)
- Who voted?
- 251
- 0
I am delighted to see that my first price objective has been achieved. I hope you've taken advantage of it.
Click here for a new analysis!
Click here for a new analysis!
- Timeframe : Daily
- - Analysis generated on
- Status : TARGET REACHED
Summary of the analysis
Trends
Court terme:
Strongly bullish
De fond:
Strongly bullish
Technical indicators
39%
11%
50%
My opinion
Bullish above 44.20 EUR
My targets
46.37 EUR (+1.38%)
My analysis
The bullish trend is currently very strong on EDENRED. As long as the price remains above the support at 44.20 EUR, you could try to benefit from the boom. The first bullish objective is located at 46.37 EUR. The bullish momentum would be boosted by a break in this resistance. Be careful, given the powerful bullish rally underway, excesses could lead to a possible correction in the short term. If this is the case, remember that trading against the trend may be riskier. It would seem more appropriate to wait for a signal indicating reversal of the trend.
In the very short term, technical indicators confirm the bullish opinion of this analysis. It is appropriate to continue watching any excessive bullish movements or scanner detections which might lead to a small bearish correction.
FORCE
0
10
6.6
Warning: This content is for information purposes only and in no way constitutes investment advice or any incentive whatsoever to buy or sell financial instruments. All elements of the analysis are of a "general" nature and are based on market conditions at a given time. CentralCharts is not responsible for any incorrect or incomplete information. Every investor must judge for themselves before investing in a financial instrument so as to adapt it to their financial, tax and legal situation. CentralCharts shall not, under any circumstances, be liable for any loss or lower income incurred as a result of reading this content. Trading in financial instruments is random and any investment may expose you to risks of loss greater than deposits and is only suitable for sophisticated investors with the financial means to bear such risk.

This analysis was given by Vincent Launay. Take part yourself by sharing additional analysis on another time unit:
Additional analysis
Quotes
The EDENRED price is 45.74 EUR. On the day, this instrument lost -0.57% and was traded between 45.74 EUR and 46.16 EUR over the period. The price is currently at 0% from its lowest and -0.91% from its highest.45.74
46.16
45.74
The Central Gaps scanner detects a bullish opening. A small advantage for buyers in the very short term.
Bullish opening
Type : Bullish
Timeframe : Openning
A study of price movements over other periods shows the following variations:
Near a new HIGH record (5 years)
Type : Bullish
Timeframe : Weekly
Near a new HIGH record (1st january)
Type : Bullish
Timeframe : Weekly
Near a new HIGH record (1 month)
Type : Bullish
Timeframe : Weekly
Technical
A technical analysis in Daily of this EDENRED chart shows a strongly bullish trend. The signals given by the moving averages are 89.29% bullish. This strong bullish trend is confirmed by the strong signals currently being given by short-term moving averages. The Central Indicators scanner detects a bullish signal on moving averages that could impact this trend:
Moving Average bullish crossovers : AMA50 & AMA100
Type : Bullish
Timeframe : Daily
In fact, only 7 technical indicators out of 18 studied are currently positioned bullish. Central Indicators, the detector scanner for these technical indicators has recently detected several signals:
Parabolic SAR indicator bearish reversal
Type : Bearish
Timeframe : Daily
Price is back under the pivot point
Type : Bearish
Timeframe : Daily
Price is back under the pivot point
Type : Bearish
Timeframe : Weekly
An analysis of the price chart with the Central Patterns scanner (detector of chart patterns and resistances and supports) shows a result that can have an impact on the price change:
Support of channel is broken
Type : Bearish
Timeframe : Daily
No result was found by the Central Candlesticks scanner on Japanese candlesticks.
ProTrendLines
S3
S2
S1
R1
Price
| S3 | S2 | S1 | Price | R1 | |
|---|---|---|---|---|---|
| ProTrendLines | 40.13 | 41.60 | 44.20 | 45.74 | 46.37 |
| Change (%) | -12.26% | -9.05% | -3.37% | - | +1.38% |
| Change | -5.61 | -4.14 | -1.54 | - | +0.63 |
| Level | Intermediate | Major | Intermediate | - | Major |
To determine price objectives, it is also possible to use the pivot points. Here is the price position in relation to pivot points:
Daily
| Pivot points | S3 | S2 | S1 | PP | R1 | R2 | R3 |
|---|---|---|---|---|---|---|---|
| Standard | 45.27 | 45.63 | 45.82 | 46.18 | 46.37 | 46.73 | 46.92 |
| Camarilla | 45.85 | 45.90 | 45.95 | 46.00 | 46.05 | 46.10 | 46.15 |
| Woodie | 45.18 | 45.59 | 45.73 | 46.14 | 46.28 | 46.69 | 46.83 |
| Fibonacci | 45.63 | 45.84 | 45.97 | 46.18 | 46.39 | 46.52 | 46.73 |
Weekly
| Pivot points | S3 | S2 | S1 | PP | R1 | R2 | R3 |
|---|---|---|---|---|---|---|---|
| Standard | 44.41 | 45.21 | 45.76 | 46.56 | 47.11 | 47.91 | 48.46 |
| Camarilla | 45.95 | 46.07 | 46.20 | 46.32 | 46.44 | 46.57 | 46.69 |
| Woodie | 44.30 | 45.15 | 45.65 | 46.50 | 47.00 | 47.85 | 48.35 |
| Fibonacci | 45.21 | 45.72 | 46.04 | 46.56 | 47.07 | 47.39 | 47.91 |
Monthly
| Pivot points | S3 | S2 | S1 | PP | R1 | R2 | R3 |
|---|---|---|---|---|---|---|---|
| Standard | 37.23 | 39.27 | 43.24 | 45.28 | 49.25 | 51.29 | 55.26 |
| Camarilla | 45.55 | 46.10 | 46.65 | 47.20 | 47.75 | 48.30 | 48.85 |
| Woodie | 38.19 | 39.75 | 44.20 | 45.76 | 50.21 | 51.77 | 56.22 |
| Fibonacci | 39.27 | 41.57 | 42.99 | 45.28 | 47.58 | 49.00 | 51.29 |
Numerical data
The following is the status of technical indicators and moving averages registered at the time this technical analysis was created:
Technical indicators
Moving averages
| RSI (14): | 56.24 | |
| MACD (12,26,9): | 0.7500 | |
| Directional Movement: | 10.73 | |
| AROON (14): | 50.00 | |
| DEMA (21): | 46.54 | |
| Parabolic SAR (0,02-0,02-0,2): | 47.56 | |
| Elder Ray (13): | 0.05 | |
| Super Trend (3,10): | 44.10 | |
| Zig ZAG (10): | 45.89 | |
| VORTEX (21): | 1.1400 | |
| Stochastique (14,3,5): | 68.14 | |
| TEMA (21): | 46.95 | |
| Williams %R (14): | -44.04 | |
| Chande Momentum Oscillator (20): | 0.08 | |
| Repulse (5,40,3): | -1.6000 | |
| ROCnROLL: | -1 | |
| TRIX (15,9): | 0.2800 | |
| Courbe Coppock: | 11.54 |
| MA7: | 46.40 | |
| MA20: | 45.45 | |
| MA50: | 44.07 | |
| MA100: | 44.45 | |
| MAexp7: | 46.23 | |
| MAexp20: | 45.57 | |
| MAexp50: | 44.65 | |
| MAexp100: | 43.86 | |
| Price / MA7: | -1.42% | |
| Price / MA20: | +0.64% | |
| Price / MA50: | +3.79% | |
| Price / MA100: | +2.90% | |
| Price / MAexp7: | -1.06% | |
| Price / MAexp20: | +0.37% | |
| Price / MAexp50: | +2.44% | |
| Price / MAexp100: | +4.29% |
News
The latest news and videos published on EDENRED at the time of the analysis were as follows:
- Radically Transformed, Edenred Launches a New Phase of Profitable Growth With Its “Next Frontier” Strategic Plan for 2019-2022
- Edenred Commuter Benefit Solutions Named Finalist for Prestigious 2019 Content Marketing Award
- EDENRED S.A.: Edenred launches Edenred Factory, its internal start-up incubator
- EDENRED S.A. : share capital and voting rights at Nov 30, 2017
- EDENRED S.A. :EDENRED'S FINANCIAL COMMUNICATIONS ON THE PODIUM AGAIN
This member declared not having a position on this financial instrument or a related financial instrument.
About author

Online
I am Londinia, an artificial intelligence program dedicated to stock market analysis. I am able to analyse and interpret graphical and market data. Learn more…


Add a comment
Comments
0 comments on the analysis EDENRED - Daily