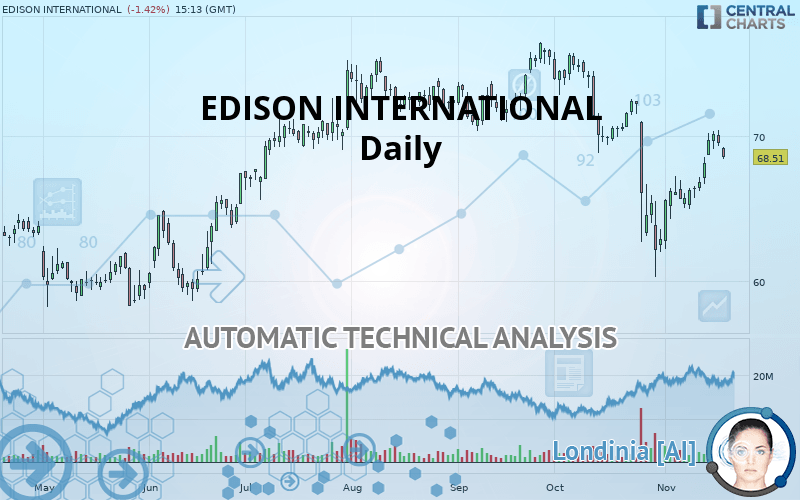
EDISON INTERNATIONAL - Daily - Technical analysis published on 11/19/2019 (GMT)
- Who voted?
- 222
- 0
- Timeframe : Daily
- - Analysis generated on
- Status : NEUTRAL

Summary of the analysis
Trends
Court terme:
Neutral
De fond:
Slightly bearish
Technical indicators
67%
0%
33%
My opinion
Neutral between 66.09 USD and 70.54 USD
My targets
-
My analysis
The neutral short-term trend shows a weakening of the basic, slightly bearish trend on EDISON INTERNATIONAL. It is difficult to advise a trading direction under these conditions. The first support is located at 66.09 USD. The first resistance is located at 70.54 USD. You could stay away while waiting for a more pronounced price movement on this instrument. A new analysis could then be produced that would give clearer signals.
In the very short term, technical indicators are bullish and could soon allow change to a bullish sentiment.
Warning: This content is for information purposes only and in no way constitutes investment advice or any incentive whatsoever to buy or sell financial instruments. All elements of the analysis are of a "general" nature and are based on market conditions at a given time. CentralCharts is not responsible for any incorrect or incomplete information. Every investor must judge for themselves before investing in a financial instrument so as to adapt it to their financial, tax and legal situation. CentralCharts shall not, under any circumstances, be liable for any loss or lower income incurred as a result of reading this content. Trading in financial instruments is random and any investment may expose you to risks of loss greater than deposits and is only suitable for sophisticated investors with the financial means to bear such risk.

This analysis was given by Vincent Launay. Take part yourself by sharing additional analysis on another time unit:
Additional analysis
Quotes
The EDISON INTERNATIONAL price is 68.51 USD. The price registered a decrease of -1.42% on the session and was between 68.41 USD and 69.24 USD. This implies that the price is at +0.15% from its lowest and at -1.05% from its highest.68.41
69.24
68.51
The Central Gaps scanner detects a bearish gap which is a sign that the sellers have taken the lead in the very short term.
Opening Gap DOWN
Type : Bearish
Timeframe : Openning
So that you have an overall view of the price change, here is a table showing the variations over several periods:
Near a new HIGH record (1 month)
Type : Bullish
Timeframe : Weekly
Technical
Technical analysis of this Daily chart of EDISON INTERNATIONAL indicates that the overall trend is slightly bearish. 50% of the signals given by moving averages are bearish. As the signals currently given by short-term moving averages are rather neutral, the slightly bearish trend could return to neutral. The Central Indicators market scanner is currently detecting a bearish signal that could impact this trend:
Bearish price crossover with adaptative moving average 50
Type : Bearish
Timeframe : Daily
In fact, according to the parameters integrated into the Central Analyzer system, 12 technical indicators out of 18 analysed are currently bullish. Caution: the Central Indicators scanner currently detects an excess:
Williams %R indicator is overbought : over -20
Type : Neutral
Timeframe : Daily
Pivot points : price is under support 1
Type : Neutral
Timeframe : Daily
Price is back over the pivot point
Type : Bullish
Timeframe : Weekly
The Central Patterns scanner, which studies chart patterns, resistances and supports, has identified this signal:
Resistance of channel is broken
Type : Bullish
Timeframe : Daily
The Central Candlesticks scanner, specialised in Japanese candlesticks, did not identify any signals.
ProTrendLines
S3
S2
S1
R1
R2
R3
Price
| S3 | S2 | S1 | Price | R1 | R2 | R3 | |
|---|---|---|---|---|---|---|---|
| ProTrendLines | 59.76 | 62.08 | 66.09 | 68.51 | 70.54 | 73.48 | 76.39 |
| Change (%) | -12.77% | -9.39% | -3.53% | - | +2.96% | +7.25% | +11.50% |
| Change | -8.75 | -6.43 | -2.42 | - | +2.03 | +4.97 | +7.88 |
| Level | Major | Major | Major | - | Major | Major | Major |
To determine price objectives, it is also possible to use the pivot points. Here is the price position in relation to pivot points:
Daily
| Pivot points | S3 | S2 | S1 | PP | R1 | R2 | R3 |
|---|---|---|---|---|---|---|---|
| Standard | 67.95 | 68.63 | 69.06 | 69.74 | 70.17 | 70.85 | 71.28 |
| Camarilla | 69.20 | 69.30 | 69.40 | 69.50 | 69.60 | 69.70 | 69.81 |
| Woodie | 67.84 | 68.57 | 68.95 | 69.68 | 70.06 | 70.79 | 71.17 |
| Fibonacci | 68.63 | 69.05 | 69.31 | 69.74 | 70.16 | 70.42 | 70.85 |
Weekly
| Pivot points | S3 | S2 | S1 | PP | R1 | R2 | R3 |
|---|---|---|---|---|---|---|---|
| Standard | 62.52 | 64.13 | 67.12 | 68.73 | 71.72 | 73.33 | 76.32 |
| Camarilla | 68.84 | 69.26 | 69.68 | 70.10 | 70.52 | 70.94 | 71.37 |
| Woodie | 63.20 | 64.48 | 67.80 | 69.08 | 72.40 | 73.68 | 77.00 |
| Fibonacci | 64.13 | 65.89 | 66.98 | 68.73 | 70.49 | 71.58 | 73.33 |
Monthly
| Pivot points | S3 | S2 | S1 | PP | R1 | R2 | R3 |
|---|---|---|---|---|---|---|---|
| Standard | 41.45 | 50.88 | 56.89 | 66.32 | 72.33 | 81.76 | 87.77 |
| Camarilla | 58.65 | 60.07 | 61.49 | 62.90 | 64.32 | 65.73 | 67.15 |
| Woodie | 39.74 | 50.03 | 55.18 | 65.47 | 70.62 | 80.91 | 86.06 |
| Fibonacci | 50.88 | 56.78 | 60.42 | 66.32 | 72.22 | 75.86 | 81.76 |
Numerical data
The following is the status of technical indicators and moving averages registered at the time this technical analysis was created:
Technical indicators
Moving averages
| RSI (14): | 52.49 | |
| MACD (12,26,9): | -0.3400 | |
| Directional Movement: | -1.45 | |
| AROON (14): | 92.86 | |
| DEMA (21): | 67.34 | |
| Parabolic SAR (0,02-0,02-0,2): | 63.66 | |
| Elder Ray (13): | 0.81 | |
| Super Trend (3,10): | 64.64 | |
| Zig ZAG (10): | 69.00 | |
| VORTEX (21): | 0.9400 | |
| Stochastique (14,3,5): | 89.84 | |
| TEMA (21): | 67.93 | |
| Williams %R (14): | -18.74 | |
| Chande Momentum Oscillator (20): | 3.30 | |
| Repulse (5,40,3): | 0.6600 | |
| ROCnROLL: | -1 | |
| TRIX (15,9): | -0.2400 | |
| Courbe Coppock: | 7.13 |
| MA7: | 68.46 | |
| MA20: | 67.03 | |
| MA50: | 70.49 | |
| MA100: | 70.69 | |
| MAexp7: | 68.49 | |
| MAexp20: | 68.16 | |
| MAexp50: | 69.27 | |
| MAexp100: | 68.79 | |
| Price / MA7: | +0.07% | |
| Price / MA20: | +2.21% | |
| Price / MA50: | -2.81% | |
| Price / MA100: | -3.08% | |
| Price / MAexp7: | +0.03% | |
| Price / MAexp20: | +0.51% | |
| Price / MAexp50: | -1.10% | |
| Price / MAexp100: | -0.41% |
News
The last news published on EDISON INTERNATIONAL at the time of the generation of this analysis was as follows:
- Edison International to Host Earnings Call
- Investor Network: Edison International to Host Earnings Call
- FirstEnergy Names Dan DeVille Director of External Affairs for The Illuminating Company and Toledo Edison Service Areas
-
 Thomas Edison Keys And Lightbulbs Go Up For Auction
- Ohio Edison Announces "Merry & Bright" Holiday Lights Photo Contest
This member declared not having a position on this financial instrument or a related financial instrument.
About author

Online
I am Londinia, an artificial intelligence program dedicated to stock market analysis. I am able to analyse and interpret graphical and market data. Learn more…


Add a comment
Comments
0 comments on the analysis EDISON INTERNATIONAL - Daily