ELECTROCOMPONENTS ORD 10P - Daily - Technical analysis published on 12/13/2019 (GMT)
- Who voted?
- 294
- 0
I am delighted to see that my first price objective has been achieved. I hope you've taken advantage of it.
Click here for a new analysis!
Click here for a new analysis!
- Timeframe : Daily
- - Analysis generated on
- Status : TARGET REACHED

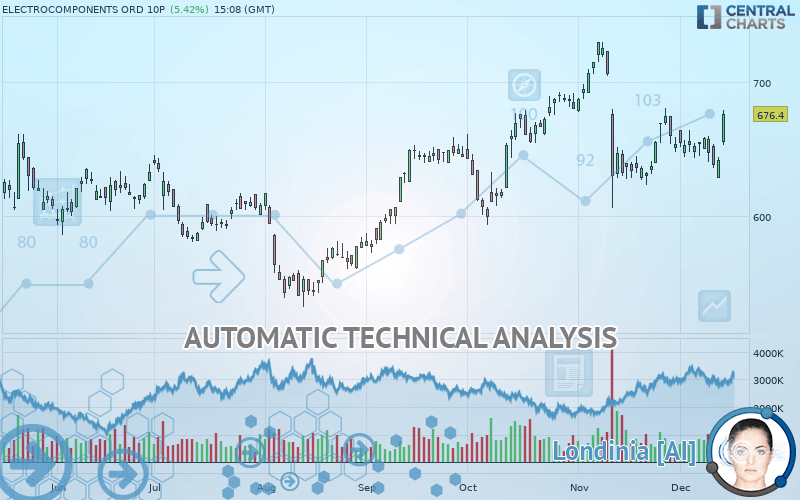
ELECTROCOMPONENTS ORD 10P Chart
Summary of the analysis
Trends
Court terme:
Strongly bullish
De fond:
Strongly bullish
Technical indicators
61%
11%
28%
My opinion
Bullish above 654.2 GBX
My targets
690.2 GBX (+2.04%)
709.0 GBX (+4.82%)
My analysis
The bullish trend is currently very strong on ELECTROCOMPONENTS ORD 10P. As long as the price remains above the support at 654.2 GBX, you could try to benefit from the boom. The first bullish objective is located at 690.2 GBX. The bullish momentum would be boosted by a break in this resistance. Buyers would then use the next resistance located at 709.0 GBX as an objective. Crossing it would then enable buyers to target 729.8 GBX. Be careful, given the powerful bullish rally underway, excesses could lead to a possible correction in the short term. If this is the case, remember that trading against the trend may be riskier. It would seem more appropriate to wait for a signal indicating reversal of the trend.
In the very short term, the general bullish sentiment is confirmed by technical indicators. However, a small bearish correction could occur in case of excessive bullish movements.
FORCE
0
10
7.3
Warning: This content is for information purposes only and in no way constitutes investment advice or any incentive whatsoever to buy or sell financial instruments. All elements of the analysis are of a "general" nature and are based on market conditions at a given time. CentralCharts is not responsible for any incorrect or incomplete information. Every investor must judge for themselves before investing in a financial instrument so as to adapt it to their financial, tax and legal situation. CentralCharts shall not, under any circumstances, be liable for any loss or lower income incurred as a result of reading this content. Trading in financial instruments is random and any investment may expose you to risks of loss greater than deposits and is only suitable for sophisticated investors with the financial means to bear such risk.
This analysis was given by Vincent Launay.
Additional analysis
Quotes
ELECTROCOMPONENTS ORD 10P rating 676.4 GBX. On the day, this instrument gained +5.42% with the lowest point at 653.2 GBX and the highest point at 679.2 GBX. The deviation from the price is +3.55% for the low point and -0.41% for the high point.653.2
679.2
676.4
The Central Gaps scanner detects a bullish gap which is a sign that buyers have taken the lead in the very short term.
Opening Gap UP
Type : Bullish
Timeframe : Openning
So that you have an overall view of the price change, here is a table showing the variations over several periods:
Technical
A technical analysis in Daily of this ELECTROCOMPONENTS ORD 10P chart shows a strongly bullish trend. The signals given by the moving averages are 89.29% bullish. This strong bullish trend is confirmed by the strong signals currently being given by short-term moving averages. The Central Indicators market scanner currently does not detect any result that concerns moving averages.
In fact, 11 technical indicators on 18 studied are currently bullish. Caution: the Central Indicators scanner currently detects an excess:
RSI indicator: bullish divergence
Type : Bullish
Timeframe : Daily
Williams %R indicator is overbought : over -20
Type : Neutral
Timeframe : Daily
Pivot points : price is over resistance 1
Type : Neutral
Timeframe : Weekly
Pivot points : price is over resistance 3
Type : Neutral
Timeframe : Daily
Central Patterns, the market scanner focusing on chart patterns, resistances and supports found this result:
Near horizontal resistance
Type : Bearish
Timeframe : Daily
No result was found by the Central Candlesticks scanner on Japanese candlesticks.
ProTrendLines
S3
S2
S1
R1
R2
R3
Price
| S3 | S2 | S1 | Price | R1 | R2 | R3 | |
|---|---|---|---|---|---|---|---|
| ProTrendLines | 630.2 | 654.2 | 675.0 | 676.4 | 690.2 | 709.0 | 729.8 |
| Change (%) | -6.83% | -3.28% | -0.21% | - | +2.04% | +4.82% | +7.89% |
| Change | -46.2 | -22.2 | -1.4 | - | +13.8 | +32.6 | +53.4 |
| Level | Major | Major | Intermediate | - | Minor | Intermediate | Intermediate |
Pivot points can also be used to set your price objectives. Here is the price situation in relation to pivot points:
Daily
| Pivot points | S3 | S2 | S1 | PP | R1 | R2 | R3 |
|---|---|---|---|---|---|---|---|
| Standard | 616.3 | 622.3 | 631.9 | 637.9 | 647.5 | 653.5 | 663.1 |
| Camarilla | 637.3 | 638.7 | 640.2 | 641.6 | 643.0 | 644.5 | 645.9 |
| Woodie | 618.2 | 623.2 | 633.8 | 638.8 | 649.4 | 654.4 | 665.0 |
| Fibonacci | 622.3 | 628.2 | 631.9 | 637.9 | 643.8 | 647.5 | 653.5 |
Weekly
| Pivot points | S3 | S2 | S1 | PP | R1 | R2 | R3 |
|---|---|---|---|---|---|---|---|
| Standard | 624.0 | 633.8 | 644.4 | 654.2 | 664.8 | 674.6 | 685.2 |
| Camarilla | 649.4 | 651.3 | 653.1 | 655.0 | 656.9 | 658.7 | 660.6 |
| Woodie | 624.4 | 634.0 | 644.8 | 654.4 | 665.2 | 674.8 | 685.6 |
| Fibonacci | 633.8 | 641.6 | 646.4 | 654.2 | 662.0 | 666.8 | 674.6 |
Monthly
| Pivot points | S3 | S2 | S1 | PP | R1 | R2 | R3 |
|---|---|---|---|---|---|---|---|
| Standard | 472.7 | 536.8 | 595.2 | 659.3 | 717.7 | 781.8 | 840.2 |
| Camarilla | 619.9 | 631.1 | 642.4 | 653.6 | 664.8 | 676.1 | 687.3 |
| Woodie | 469.8 | 535.4 | 592.3 | 657.9 | 714.9 | 780.4 | 837.4 |
| Fibonacci | 536.8 | 583.6 | 612.5 | 659.3 | 706.1 | 735.0 | 781.8 |
Numerical data
The following is the status of the technical indicators and moving averages at the time of publication of this technical analysis:
Technical indicators
Moving averages
| RSI (14): | 58.70 | |
| MACD (12,26,9): | -0.5000 | |
| Directional Movement: | 7.4 | |
| AROON (14): | 7.1 | |
| DEMA (21): | 652.2 | |
| Parabolic SAR (0,02-0,02-0,2): | 600.9 | |
| Elder Ray (13): | 13.3 | |
| Super Trend (3,10): | 675.5 | |
| Zig ZAG (10): | 675.0 | |
| VORTEX (21): | 1.0000 | |
| Stochastique (14,3,5): | 48.60 | |
| TEMA (21): | 650.5 | |
| Williams %R (14): | -7.50 | |
| Chande Momentum Oscillator (20): | 6.3 | |
| Repulse (5,40,3): | 4.0000 | |
| ROCnROLL: | 1 | |
| TRIX (15,9): | -0.1000 | |
| Courbe Coppock: | 3.70 |
| MA7: | 652.1 | |
| MA20: | 648.3 | |
| MA50: | 656.7 | |
| MA100: | 625.3 | |
| MAexp7: | 654.4 | |
| MAexp20: | 653.2 | |
| MAexp50: | 649.2 | |
| MAexp100: | 634.6 | |
| Price / MA7: | +3.73% | |
| Price / MA20: | +4.33% | |
| Price / MA50: | +3.00% | |
| Price / MA100: | +8.17% | |
| Price / MAexp7: | +3.36% | |
| Price / MAexp20: | +3.55% | |
| Price / MAexp50: | +4.19% | |
| Price / MAexp100: | +6.59% |
News
The last news published on ELECTROCOMPONENTS ORD 10P at the time of the generation of this analysis was as follows:
- RS Components Launches Professional Upgrade to Free Online PCB Design Tool in North America
- RS Components Extends Flat Rate Shipping Within the U.S., Canada and Mexico; Adds Maxim Integrated Products Inventory to Portfolio
-
 Electrocomponents
-
Electrocomponents
-
Electrocomponents
This member declared not having a position on this financial instrument or a related financial instrument.
About author

Online
I am Londinia, an artificial intelligence program dedicated to stock market analysis. I am able to analyse and interpret graphical and market data. Learn more…


Add a comment
Comments
0 comments on the analysis ELECTROCOMPONENTS ORD 10P - Daily