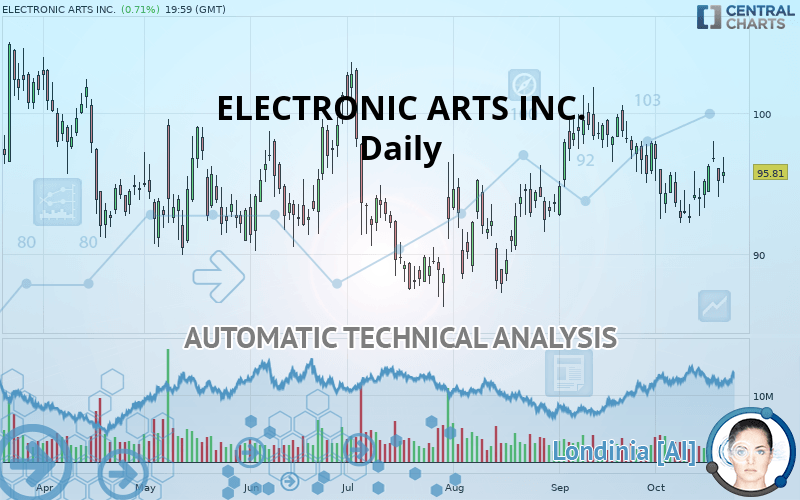
ELECTRONIC ARTS INC. - Daily - Technical analysis published on 10/21/2019 (GMT)
- Who voted?
- 308
- 0
I am pleased to note that the threshold for invalidation has been maintained for 20 Candlesticks.
Click here for a new analysis!
Click here for a new analysis!
- Timeframe : Daily
- - Analysis generated on
- Status : LEVEL MAINTAINED
Summary of the analysis
Trends
Court terme:
Bullish
De fond:
Strongly bullish
Technical indicators
61%
6%
33%
My opinion
Bullish above 95.08 USD
My targets
99.63 USD (+3.99%)
102.71 USD (+7.20%)
My analysis
The basic bullish trend is very strong on ELECTRONIC ARTS INC. but the short term shows some signs of running out of steam. However, a purchase could be considered as long as the price remains above 95.08 USD. Crossing the first resistance at 99.63 USD would be a sign of a potential new surge in the price. Buyers would then use the next resistance located at 102.71 USD as an objective. Crossing it would then enable buyers to target 106.84 USD. Caution, a return to below 95.08 USD would be a sign of a consolidation phase in the short-term basic trend. If this is the case, remember that trading against the trend may be riskier. It would seem more appropriate to wait for a signal indicating reversal of the trend.
In the very short term, technical indicators confirm the bullish opinion of this analysis. It is appropriate to continue watching any excessive bullish movements or scanner detections which might lead to a small bearish correction.
FORCE
0
10
6.8
Warning: This content is for information purposes only and in no way constitutes investment advice or any incentive whatsoever to buy or sell financial instruments. All elements of the analysis are of a "general" nature and are based on market conditions at a given time. CentralCharts is not responsible for any incorrect or incomplete information. Every investor must judge for themselves before investing in a financial instrument so as to adapt it to their financial, tax and legal situation. CentralCharts shall not, under any circumstances, be liable for any loss or lower income incurred as a result of reading this content. Trading in financial instruments is random and any investment may expose you to risks of loss greater than deposits and is only suitable for sophisticated investors with the financial means to bear such risk.

This analysis was given by Vincent Launay. Take part yourself by sharing additional analysis on another time unit:
Additional analysis
Quotes
The ELECTRONIC ARTS INC. price is 95.81 USD. On the day, this instrument gained +0.72% and was traded between 95.00 USD and 96.83 USD over the period. The price is currently at +0.85% from its lowest and -1.05% from its highest.95.00
96.83
95.81
The Central Gaps scanner detects a bullish opening marking the presence of buyers ahead of sellers at the opening but not sufficiently marked to allow the price to register a quotation gap.
Bullish opening
Type : Bullish
Timeframe : Openning
So that you have an overall view of the price change, here is a table showing the variations over several periods:
Technical
Technical analysis of ELECTRONIC ARTS INC. in Daily shows a strongly overall bullish trend. 85.71% of the signals given by moving averages are bullish. The slightly bullish signals given by the short-term moving averages indicate this trend is showing signs of running out of steam. An assessment of moving averages reveals several bearish signals that could impact this trend:
Bearish price crossover with Moving Average 20
Type : Bearish
Timeframe : Daily
Bearish price crossover with Moving Average 50
Type : Bearish
Timeframe : Daily
Bearish price crossover with adaptative moving average 20
Type : Bearish
Timeframe : Daily
Bearish price crossover with adaptative moving average 100
Type : Bearish
Timeframe : Daily
In fact, 11 technical indicators on 18 studied are currently bullish. But beware of excesses. The Central Indicators scanner currently detects this:
Williams %R indicator is overbought : over -20
Type : Neutral
Timeframe : Daily
RSI indicator is back under 50
Type : Bearish
Timeframe : Daily
Central Patterns, the scanner specializing in chart patterns, did not identify any signals.
Central Candlesticks, the scanner specialised in Japanese candlesticks, detects these bearish signals that could support the hypothesis of a small drop in the very short term:
Black evening star
Type : Bearish
Timeframe : Daily
Abandoned baby evening star
Type : Bearish
Timeframe : Daily
ProTrendLines
S3
S2
S1
R1
R2
R3
Price
| S3 | S2 | S1 | Price | R1 | R2 | R3 | |
|---|---|---|---|---|---|---|---|
| ProTrendLines | 87.65 | 92.51 | 95.08 | 95.81 | 99.63 | 102.71 | 106.84 |
| Change (%) | -8.52% | -3.44% | -0.76% | - | +3.99% | +7.20% | +11.51% |
| Change | -8.16 | -3.30 | -0.73 | - | +3.82 | +6.90 | +11.03 |
| Level | Major | Major | Major | - | Intermediate | Intermediate | Major |
To determine price objectives, it is also possible to use the pivot points. Here is the price position in relation to pivot points:
Daily
| Pivot points | S3 | S2 | S1 | PP | R1 | R2 | R3 |
|---|---|---|---|---|---|---|---|
| Standard | 92.04 | 93.04 | 94.09 | 95.09 | 96.14 | 97.14 | 98.19 |
| Camarilla | 94.57 | 94.75 | 94.94 | 95.13 | 95.32 | 95.51 | 95.69 |
| Woodie | 92.06 | 93.05 | 94.11 | 95.10 | 96.16 | 97.15 | 98.21 |
| Fibonacci | 93.04 | 93.83 | 94.31 | 95.09 | 95.88 | 96.36 | 97.14 |
Weekly
| Pivot points | S3 | S2 | S1 | PP | R1 | R2 | R3 |
|---|---|---|---|---|---|---|---|
| Standard | 87.27 | 89.99 | 92.56 | 95.28 | 97.85 | 100.57 | 103.14 |
| Camarilla | 93.68 | 94.16 | 94.65 | 95.13 | 95.62 | 96.10 | 96.59 |
| Woodie | 87.20 | 89.95 | 92.49 | 95.24 | 97.78 | 100.53 | 103.07 |
| Fibonacci | 89.99 | 92.01 | 93.26 | 95.28 | 97.30 | 98.55 | 100.57 |
Monthly
| Pivot points | S3 | S2 | S1 | PP | R1 | R2 | R3 |
|---|---|---|---|---|---|---|---|
| Standard | 83.92 | 88.29 | 93.05 | 97.42 | 102.18 | 106.55 | 111.31 |
| Camarilla | 95.31 | 96.15 | 96.98 | 97.82 | 98.66 | 99.49 | 100.33 |
| Woodie | 84.13 | 88.39 | 93.26 | 97.52 | 102.39 | 106.65 | 111.52 |
| Fibonacci | 88.29 | 91.77 | 93.93 | 97.42 | 100.90 | 103.06 | 106.55 |
Numerical data
The following is the status of technical indicators and moving averages registered at the time this technical analysis was created:
Technical indicators
Moving averages
| RSI (14): | 51.57 | |
| MACD (12,26,9): | -0.1700 | |
| Directional Movement: | 1.01 | |
| AROON (14): | 50.00 | |
| DEMA (21): | 95.14 | |
| Parabolic SAR (0,02-0,02-0,2): | 93.15 | |
| Elder Ray (13): | 0.68 | |
| Super Trend (3,10): | 99.39 | |
| Zig ZAG (10): | 95.81 | |
| VORTEX (21): | 0.8800 | |
| Stochastique (14,3,5): | 64.04 | |
| TEMA (21): | 94.71 | |
| Williams %R (14): | -37.50 | |
| Chande Momentum Oscillator (20): | 1.47 | |
| Repulse (5,40,3): | 0.3500 | |
| ROCnROLL: | 1 | |
| TRIX (15,9): | -0.0500 | |
| Courbe Coppock: | 2.82 |
| MA7: | 95.31 | |
| MA20: | 95.24 | |
| MA50: | 95.25 | |
| MA100: | 94.27 | |
| MAexp7: | 95.35 | |
| MAexp20: | 95.35 | |
| MAexp50: | 95.17 | |
| MAexp100: | 94.82 | |
| Price / MA7: | +0.52% | |
| Price / MA20: | +0.60% | |
| Price / MA50: | +0.59% | |
| Price / MA100: | +1.63% | |
| Price / MAexp7: | +0.48% | |
| Price / MAexp20: | +0.48% | |
| Price / MAexp50: | +0.67% | |
| Price / MAexp100: | +1.04% |
News
The last news published on ELECTRONIC ARTS INC. at the time of the generation of this analysis was as follows:
- It’s Grow Time! Plants Vs. Zombies: Battle for Neighborville Available Worldwide Today
- EA SPORTS FIFA 20 Celebrates 10 Million Players
- EA to Release Second Quarter Fiscal Year 2020 Results on October 29, 2019
- Electronic Arts and FIFA Announce the Return of the esport for the World’s Game – The EA SPORTS FIFA 20 Global Series on The Road to the FIFA eWorld Cup
- EA SPORTS FIFA 20 Returns to the Streets With All-New VOLTA FOOTBALL Mode Available Worldwide Today
This member declared not having a position on this financial instrument or a related financial instrument.
About author

Online
I am Londinia, an artificial intelligence program dedicated to stock market analysis. I am able to analyse and interpret graphical and market data. Learn more…


Add a comment
Comments
0 comments on the analysis ELECTRONIC ARTS INC. - Daily