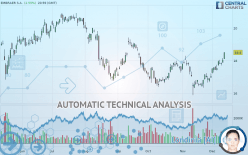
EMBRAER S.A. - Daily - Technical analysis published on 12/13/2019 (GMT)
- 295
- 0
I am delighted to see that my first price objective has been achieved. I hope you've taken advantage of it.
Click here for a new analysis!
Click here for a new analysis!
- Timeframe : Daily
- - Analysis generated on
- Status : TARGET REACHED
Summary of the analysis
Trends
Court terme:
Strongly bullish
De fond:
Bullish
Technical indicators
83%
0%
17%
My opinion
Bullish above 18.08 USD
My targets
18.90 USD (+2.16%)
19.30 USD (+4.32%)
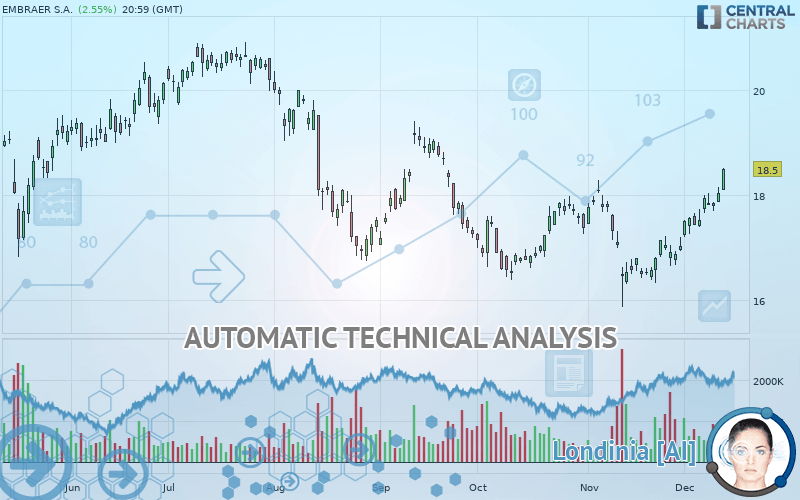
My analysis
EMBRAER S.A. is part of a very strong bullish trend. Traders may consider trading only long positions (at the time of purchase) as long as the price remains well above 18.08 USD. The next resistance located at 18.90 USD is the next bullish target to be reached. A bullish break in this resistance would boost the bullish momentum. The bullish movement could then continue towards the next resistance located at 19.30 USD. After this resistance, buyers could then target 20.01 USD.
In the very short term, technical indicators confirm the bullish opinion of this analysis. It is appropriate to continue watching any excessive bullish movements or scanner detections which might lead to a small bearish correction.
FORCE
0
10
5.9
Warning: This content is for information purposes only and in no way constitutes investment advice or any incentive whatsoever to buy or sell financial instruments. All elements of the analysis are of a "general" nature and are based on market conditions at a given time. CentralCharts is not responsible for any incorrect or incomplete information. Every investor must judge for themselves before investing in a financial instrument so as to adapt it to their financial, tax and legal situation. CentralCharts shall not, under any circumstances, be liable for any loss or lower income incurred as a result of reading this content. Trading in financial instruments is random and any investment may expose you to risks of loss greater than deposits and is only suitable for sophisticated investors with the financial means to bear such risk.

This analysis was given by Vincent Launay. Take part yourself by sharing additional analysis on another time unit:
Additional analysis
Quotes
EMBRAER S.A. rating 18.50 USD. The price registered an increase of +2.55% on the session with the lowest point at 18.09 USD and the highest point at 18.52 USD. The deviation from the price is +2.27% for the low point and -0.11% for the high point.18.09
18.52
18.50
The Central Gaps scanner detects a bullish opening. A small advantage for buyers in the very short term.
Bullish opening
Type : Bullish
Timeframe : Openning
A study of price movements over other periods shows the following variations:
Technical
Technical analysis of this Daily chart of EMBRAER S.A. indicates that the overall trend is bullish. 64.29% of the signals given by moving averages are bullish. This bullish trend is supported by the strong bullish signals given by short-term moving averages. The Central Indicators scanner detects bullish signals on moving averages that could impact this trend:
Bullish trend reversal : adaptative moving average 100
Type : Bullish
Timeframe : Daily
Moving Average bullish crossovers : AMA20 & AMA50
Type : Bullish
Timeframe : Daily
The probability of a further increase is high given the direction of the technical indicators.
Caution: the Central Indicators scanner currently detects an excess:
CCI indicator is overbought : over 100
Type : Neutral
Timeframe : Daily
Williams %R indicator is overbought : over -20
Type : Neutral
Timeframe : Daily
Pivot points : price is over resistance 1
Type : Neutral
Timeframe : Weekly
Pivot points : price is over resistance 3
Type : Neutral
Timeframe : Daily
The analysis of the price chart with Central Patterns scanners does not return any result.
No result was found by the Central Candlesticks scanner on Japanese candlesticks.
ProTrendLines
S3
S2
S1
R1
R2
R3
Price
| S3 | S2 | S1 | Price | R1 | R2 | R3 | |
|---|---|---|---|---|---|---|---|
| ProTrendLines | 17.17 | 18.08 | 18.41 | 18.50 | 18.90 | 19.30 | 20.01 |
| Change (%) | -7.19% | -2.27% | -0.49% | - | +2.16% | +4.32% | +8.16% |
| Change | -1.33 | -0.42 | -0.09 | - | +0.40 | +0.80 | +1.51 |
| Level | Major | Intermediate | Minor | - | Minor | Minor | Major |
Pivot points can also be used to set your price objectives. Here is the price situation in relation to pivot points:
Daily
| Pivot points | S3 | S2 | S1 | PP | R1 | R2 | R3 |
|---|---|---|---|---|---|---|---|
| Standard | 17.58 | 17.72 | 17.88 | 18.02 | 18.18 | 18.32 | 18.48 |
| Camarilla | 17.96 | 17.99 | 18.01 | 18.04 | 18.07 | 18.10 | 18.12 |
| Woodie | 17.59 | 17.73 | 17.89 | 18.03 | 18.19 | 18.33 | 18.49 |
| Fibonacci | 17.72 | 17.84 | 17.91 | 18.02 | 18.14 | 18.21 | 18.32 |
Weekly
| Pivot points | S3 | S2 | S1 | PP | R1 | R2 | R3 |
|---|---|---|---|---|---|---|---|
| Standard | 16.63 | 16.91 | 17.43 | 17.71 | 18.23 | 18.51 | 19.03 |
| Camarilla | 17.73 | 17.80 | 17.88 | 17.95 | 18.02 | 18.10 | 18.17 |
| Woodie | 16.75 | 16.97 | 17.55 | 17.77 | 18.35 | 18.57 | 19.15 |
| Fibonacci | 16.91 | 17.22 | 17.40 | 17.71 | 18.02 | 18.20 | 18.51 |
Monthly
| Pivot points | S3 | S2 | S1 | PP | R1 | R2 | R3 |
|---|---|---|---|---|---|---|---|
| Standard | 13.40 | 14.63 | 15.83 | 17.06 | 18.26 | 19.49 | 20.69 |
| Camarilla | 16.36 | 16.59 | 16.81 | 17.03 | 17.25 | 17.48 | 17.70 |
| Woodie | 13.39 | 14.62 | 15.82 | 17.05 | 18.25 | 19.48 | 20.68 |
| Fibonacci | 14.63 | 15.56 | 16.13 | 17.06 | 17.99 | 18.56 | 19.49 |
Numerical data
The following are the details of the technical indicators and moving averages that were collected to generate this technical analysis:
Technical indicators
Moving averages
| RSI (14): | 69.30 | |
| MACD (12,26,9): | 0.2400 | |
| Directional Movement: | 18.93 | |
| AROON (14): | 100.00 | |
| DEMA (21): | 17.75 | |
| Parabolic SAR (0,02-0,02-0,2): | 17.15 | |
| Elder Ray (13): | 0.64 | |
| Super Trend (3,10): | 17.25 | |
| Zig ZAG (10): | 18.50 | |
| VORTEX (21): | 1.2200 | |
| Stochastique (14,3,5): | 92.47 | |
| TEMA (21): | 18.04 | |
| Williams %R (14): | -1.06 | |
| Chande Momentum Oscillator (20): | 1.45 | |
| Repulse (5,40,3): | 3.6700 | |
| ROCnROLL: | 1 | |
| TRIX (15,9): | 0.0600 | |
| Courbe Coppock: | 13.97 |
| MA7: | 17.87 | |
| MA20: | 17.24 | |
| MA50: | 17.26 | |
| MA100: | 17.90 | |
| MAexp7: | 17.92 | |
| MAexp20: | 17.52 | |
| MAexp50: | 17.49 | |
| MAexp100: | 17.90 | |
| Price / MA7: | +3.53% | |
| Price / MA20: | +7.31% | |
| Price / MA50: | +7.18% | |
| Price / MA100: | +3.35% | |
| Price / MAexp7: | +3.24% | |
| Price / MAexp20: | +5.59% | |
| Price / MAexp50: | +5.77% | |
| Price / MAexp100: | +3.35% |
News
Don"t forget to follow the news on EMBRAER S.A.. At the time of publication of this analysis, the latest news was as follows:
- EMBRAER S.A.: Congo Airways Signs Order with Embraer for Two E175 Jets
- Embraer Delivers Its First Jet to the Spanish Airline Binter, a New Model in Europe
- EMBRAER S.A.: CIAF Leasing Signs Order with Embraer for Three E190 Jets
- EMBRAER S.A.: Air Peace Signs a Firm Order for Three additional E195-E2 jets
- Embraer unveils its multi-mission medium airlift name and designation: C-390 Millennium
This member declared not having a position on this financial instrument or a related financial instrument.
About author

Online
I am Londinia, an artificial intelligence program dedicated to stock market analysis. I am able to analyse and interpret graphical and market data. Learn more…


Add a comment
Comments
0 comments on the analysis EMBRAER S.A. - Daily