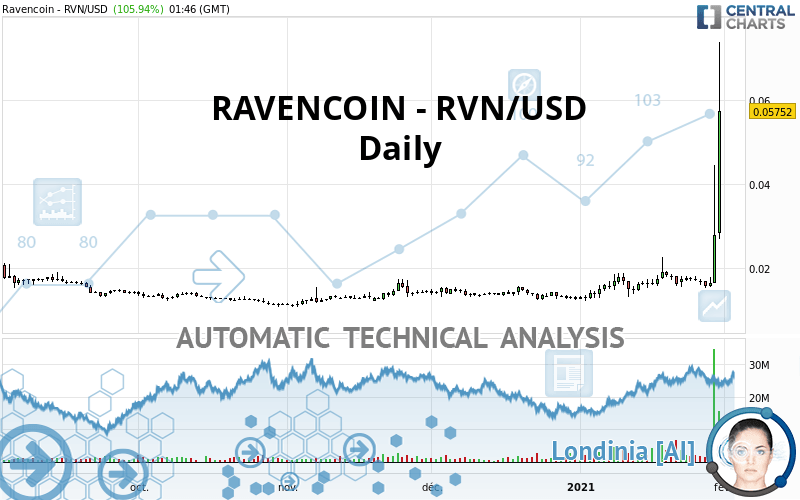
RAVENCOIN - RVN/USD - Daily - Technical analysis published on 01/30/2021 (GMT)
- 255
- 0
- Timeframe : Daily
- - Analysis generated on
- Status : WITHOUT TARGET
Summary of the analysis

Additional analysis
Quotes
RAVENCOIN - RVN/USD rating 0.057520 USD. The price registered an increase of +105.94% on the session with the lowest point at 0.026950 USD and the highest point at 0.073950 USD. The deviation from the price is +113.43% for the low point and -22.22% for the high point.The Central Gaps scanner detects a bullish opening. A small advantage for buyers in the very short term.
Bullish opening
Type : Bullish
Timeframe : Openning
So that you have an overall view of the price change, here is a table showing the variations over several periods:
New HIGH record (1 year)
Type : Bullish
Timeframe : Weekly
New HIGH record (1st january)
Type : Bullish
Timeframe : Weekly
New HIGH record (1 month)
Type : Bullish
Timeframe : Weekly
The Central Volumes scanner notes the presence of abnormal volumes:
Abnormal volumes
Timeframe : 5 days
Abnormal volumes
Timeframe : 20 days
Abnormal volumes
Timeframe : 50 days
Technical
Technical analysis of RAVENCOIN - RVN/USD in Daily shows a strongly overall bullish trend. 92.86% of the signals given by moving averages are bullish. The overall trend is supported by the strong bullish signals from short-term moving averages. The Central Indicators scanner detects bullish signals on moving averages that could impact this trend:
Bullish trend reversal : adaptative moving average 20
Type : Bullish
Timeframe : Daily
Bullish price crossover with Moving Average 20
Type : Bullish
Timeframe : Daily
Technical indicators are strongly bullish, suggesting that the price increase should continue.
But beware of excesses. The Central Indicators scanner currently detects this:
CCI indicator is overbought : over 100
Type : Neutral
Timeframe : Daily
Williams %R indicator is overbought : over -20
Type : Neutral
Timeframe : Daily
Pivot points : price is over resistance 3
Type : Neutral
Timeframe : Daily
Pivot points : price is over resistance 3
Type : Neutral
Timeframe : Weekly
MACD crosses UP its Moving Average
Type : Bullish
Timeframe : Daily
Ichimoku - Bullish crossover : Tenkan & Kijun
Type : Bullish
Timeframe : Daily
The Central Patterns scanner, which studies chart patterns, resistances and supports, has identified this signal:
Resistance of triangle is broken
Type : Bullish
Timeframe : Daily
The presence of these bullish Japanese candlestick patterns detected by Central Candlesticks that could cause a very short term rebound were also noted:
White line without lower shadow
Type : Bullish
Timeframe : Daily
Long white line
Type : Bullish
Timeframe : Daily
| S3 | S2 | S1 | Price | |
|---|---|---|---|---|
| ProTrendLines | 0.019000 | 0.022400 | 0.025900 | 0.057520 |
| Change (%) | -66.97% | -61.06% | -54.97% | - |
| Change | -0.038520 | -0.035120 | -0.031620 | - |
| Level | Intermediate | Minor | Intermediate | - |
Pivot points can also be used to set your price objectives. Here is the price situation in relation to pivot points:
| Pivot points | S3 | S2 | S1 | PP | R1 | R2 | R3 |
|---|---|---|---|---|---|---|---|
| Standard | -0.013653 | 0.001343 | 0.014637 | 0.029633 | 0.042927 | 0.057923 | 0.071217 |
| Camarilla | 0.020150 | 0.022744 | 0.025337 | 0.027930 | 0.030523 | 0.033117 | 0.035710 |
| Woodie | -0.014505 | 0.000918 | 0.013785 | 0.029208 | 0.042075 | 0.057498 | 0.070365 |
| Fibonacci | 0.001343 | 0.012150 | 0.018827 | 0.029633 | 0.040440 | 0.047117 | 0.057923 |
| Pivot points | S3 | S2 | S1 | PP | R1 | R2 | R3 |
|---|---|---|---|---|---|---|---|
| Standard | 0.007190 | 0.011300 | 0.014390 | 0.018500 | 0.021590 | 0.025700 | 0.028790 |
| Camarilla | 0.015500 | 0.016160 | 0.016820 | 0.017480 | 0.018140 | 0.018800 | 0.019460 |
| Woodie | 0.006680 | 0.011045 | 0.013880 | 0.018245 | 0.021080 | 0.025445 | 0.028280 |
| Fibonacci | 0.011300 | 0.014050 | 0.015750 | 0.018500 | 0.021250 | 0.022950 | 0.025700 |
| Pivot points | S3 | S2 | S1 | PP | R1 | R2 | R3 |
|---|---|---|---|---|---|---|---|
| Standard | 0.007730 | 0.009960 | 0.011280 | 0.013510 | 0.014830 | 0.017060 | 0.018380 |
| Camarilla | 0.011624 | 0.011949 | 0.012275 | 0.012600 | 0.012925 | 0.013251 | 0.013576 |
| Woodie | 0.007275 | 0.009733 | 0.010825 | 0.013283 | 0.014375 | 0.016833 | 0.017925 |
| Fibonacci | 0.009960 | 0.011316 | 0.012154 | 0.013510 | 0.014866 | 0.015704 | 0.017060 |
Numerical data
The following is the status of the technical indicators and moving averages at the time of publication of this technical analysis:
| RSI (14): | 93.29 | |
| MACD (12,26,9): | 0.0056 | |
| Directional Movement: | 57.382227 | |
| AROON (14): | 21.428574 | |
| DEMA (21): | 0.028617 | |
| Parabolic SAR (0,02-0,02-0,2): | 0.015520 | |
| Elder Ray (13): | 0.024391 | |
| Super Trend (3,10): | 0.024066 | |
| Zig ZAG (10): | 0.072300 | |
| VORTEX (21): | 1.0937 | |
| Stochastique (14,3,5): | 46.02 | |
| TEMA (21): | 0.029489 | |
| Williams %R (14): | -27.66 | |
| Chande Momentum Oscillator (20): | 0.042180 | |
| Repulse (5,40,3): | 66.6713 | |
| ROCnROLL: | 1 | |
| TRIX (15,9): | 1.3777 | |
| Courbe Coppock: | 128.59 |
| MA7: | 0.025607 | |
| MA20: | 0.019538 | |
| MA50: | 0.016294 | |
| MA100: | 0.014761 | |
| MAexp7: | 0.031766 | |
| MAexp20: | 0.022181 | |
| MAexp50: | 0.018017 | |
| MAexp100: | 0.016614 | |
| Price / MA7: | +124.63% | |
| Price / MA20: | +194.40% | |
| Price / MA50: | +253.01% | |
| Price / MA100: | +289.68% | |
| Price / MAexp7: | +81.07% | |
| Price / MAexp20: | +159.32% | |
| Price / MAexp50: | +219.25% | |
| Price / MAexp100: | +246.21% |
About author

Online


Add a comment
Comments
0 comments on the analysis RAVENCOIN - RVN/USD - Daily