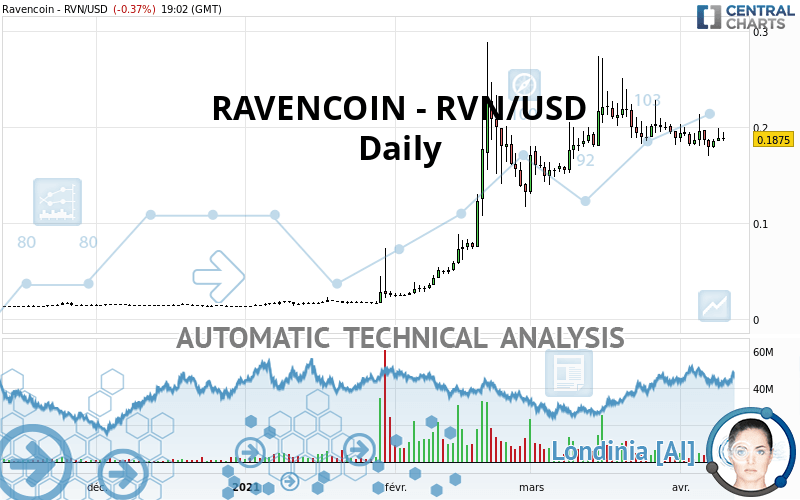
RAVENCOIN - RVN/USD - Daily - Technical analysis published on 04/10/2021 (GMT)
- 243
- 0
Click here for a new analysis!
- Timeframe : Daily
- - Analysis generated on
- Status : TARGET REACHED

Summary of the analysis

Additional analysis
Quotes
The RAVENCOIN - RVN/USD price is 0.187500 USD. On the day, this instrument lost -0.37% with the lowest point at 0.185500 USD and the highest point at 0.194200 USD. The deviation from the price is +1.08% for the low point and -3.45% for the high point.The Central Gaps scanner detects a bearish opening marking the presence of sellers ahead of buyers at the opening but not sufficiently marked to allow the price to register a quotation gap.
Bearish opening
Type : Bearish
Timeframe : Openning
So that you have an overall view of the price change, here is a table showing the variations over several periods:
Abnormal volumes
Timeframe : 50 days
Technical
A technical analysis in Daily of this RAVENCOIN - RVN/USD chart shows a bullish trend. The signals given by moving averages are 71.43% bullish. This bullish trend could slow down given the neutral signals currently being given by short-term moving averages. The Central Indicators market scanner is currently detecting a bullish signal that could impact this trend:
Bullish price crossover with Moving Average 50
Type : Bullish
Timeframe : Daily
In fact, of the 18 technical indicators analysed by Central Analyzer, 5 are bullish, 9 are neutral and 4 are bearish. But beware of excesses. The Central Indicators scanner currently detects this:
CCI indicator: bearish divergence
Type : Bearish
Timeframe : Daily
MACD indicator: bullish divergence
Type : Bullish
Timeframe : Daily
RSI indicator: bearish divergence
Type : Bearish
Timeframe : Daily
Williams %R indicator is overbought : over -20
Type : Neutral
Timeframe : Daily
Pivot points : price is over resistance 2
Type : Neutral
Timeframe : Weekly
Pivot points : price is over resistance 3
Type : Neutral
Timeframe : Daily
Pivot points : price is under support 3
Type : Neutral
Timeframe : Daily
Price is back under the pivot point
Type : Bearish
Timeframe : Weekly
An analysis of the price chart with the Central Patterns scanner (detector of chart patterns and resistances and supports) shows a result that can have an impact on the price change:
Near horizontal support
Type : Bullish
Timeframe : Daily
The Central Candlesticks scanner, specialised in Japanese candlesticks, did not identify any signals.
| S3 | S2 | S1 | Price | R1 | R2 | |
|---|---|---|---|---|---|---|
| ProTrendLines | 0.131800 | 0.154300 | 0.181567 | 0.187500 | 0.202400 | 0.229200 |
| Change (%) | -29.71% | -17.71% | -3.16% | - | +7.95% | +22.24% |
| Change | -0.055700 | -0.033200 | -0.005933 | - | +0.014900 | +0.041700 |
| Level | Major | Minor | Intermediate | - | Minor | Major |
Pivot points can also be used to set your price objectives. Here is the price situation in relation to pivot points:
| Pivot points | S3 | S2 | S1 | PP | R1 | R2 | R3 |
|---|---|---|---|---|---|---|---|
| Standard | 0.169200 | 0.173300 | 0.179400 | 0.183500 | 0.189600 | 0.193700 | 0.199800 |
| Camarilla | 0.182695 | 0.183630 | 0.184565 | 0.185500 | 0.186435 | 0.187370 | 0.188305 |
| Woodie | 0.170200 | 0.173800 | 0.180400 | 0.184000 | 0.190600 | 0.194200 | 0.200800 |
| Fibonacci | 0.173300 | 0.177196 | 0.179604 | 0.183500 | 0.187396 | 0.189804 | 0.193700 |
| Pivot points | S3 | S2 | S1 | PP | R1 | R2 | R3 |
|---|---|---|---|---|---|---|---|
| Standard | 0.143100 | 0.161500 | 0.171800 | 0.190200 | 0.200500 | 0.218900 | 0.229200 |
| Camarilla | 0.174208 | 0.176838 | 0.179469 | 0.182100 | 0.184731 | 0.187362 | 0.189993 |
| Woodie | 0.139050 | 0.159475 | 0.167750 | 0.188175 | 0.196450 | 0.216875 | 0.225150 |
| Fibonacci | 0.161500 | 0.172463 | 0.179237 | 0.190200 | 0.201163 | 0.207937 | 0.218900 |
| Pivot points | S3 | S2 | S1 | PP | R1 | R2 | R3 |
|---|---|---|---|---|---|---|---|
| Standard | -0.021800 | 0.054200 | 0.121200 | 0.197200 | 0.264200 | 0.340200 | 0.407200 |
| Camarilla | 0.148875 | 0.161983 | 0.175092 | 0.188200 | 0.201308 | 0.214417 | 0.227525 |
| Woodie | -0.026300 | 0.051950 | 0.116700 | 0.194950 | 0.259700 | 0.337950 | 0.402700 |
| Fibonacci | 0.054200 | 0.108826 | 0.142574 | 0.197200 | 0.251826 | 0.285574 | 0.340200 |
Numerical data
The following is the status of technical indicators and moving averages registered at the time this technical analysis was created:
| RSI (14): | 49.46 | |
| MACD (12,26,9): | 0.0012 | |
| Directional Movement: | 11.276453 | |
| AROON (14): | -78.571426 | |
| DEMA (21): | 0.193144 | |
| Parabolic SAR (0,02-0,02-0,2): | 0.240094 | |
| Elder Ray (13): | 0.000930 | |
| Super Trend (3,10): | 0.136708 | |
| Zig ZAG (10): | 0.186300 | |
| VORTEX (21): | 0.9368 | |
| Stochastique (14,3,5): | 32.92 | |
| TEMA (21): | 0.182244 | |
| Williams %R (14): | -60.28 | |
| Chande Momentum Oscillator (20): | -0.013400 | |
| Repulse (5,40,3): | -3.7753 | |
| ROCnROLL: | -1 | |
| TRIX (15,9): | 0.2580 | |
| Courbe Coppock: | 11.85 |
| MA7: | 0.186043 | |
| MA20: | 0.191640 | |
| MA50: | 0.185792 | |
| MA100: | 0.108970 | |
| MAexp7: | 0.187006 | |
| MAexp20: | 0.189330 | |
| MAexp50: | 0.169295 | |
| MAexp100: | 0.129684 | |
| Price / MA7: | +0.78% | |
| Price / MA20: | -2.16% | |
| Price / MA50: | +0.92% | |
| Price / MA100: | +72.07% | |
| Price / MAexp7: | +0.26% | |
| Price / MAexp20: | -0.97% | |
| Price / MAexp50: | +10.75% | |
| Price / MAexp100: | +44.58% |
About author

Online


Add a comment
Comments
0 comments on the analysis RAVENCOIN - RVN/USD - Daily