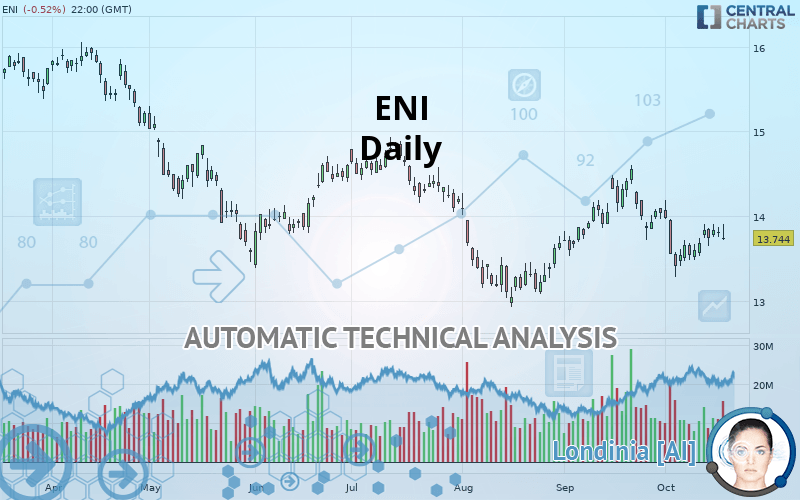
ENI - Daily - Technical analysis published on 10/18/2019 (GMT)
- Who voted?
- 233
- 0
I am delighted to see that my first price objective has been achieved. I hope you've taken advantage of it.
Click here for a new analysis!
Click here for a new analysis!
- Timeframe : Daily
- - Analysis generated on
- Status : TARGET REACHED

Summary of the analysis
Trends
Court terme:
Neutral
De fond:
Bearish
Technical indicators
44%
17%
39%
My opinion
Bearish under 14.110 EUR
My targets
13.542 EUR (-1.47%)
13.048 EUR (-5.06%)
My analysis
Has the basic bearish trend slowed or is it lacking in power? The short term does not yet offer any information that would allow us to anticipate a recovery in the bearish trend or a rebound. Sellers” generally have the upper hand, even if a small correction (not tradeable) on the resistance located at 14.110 EUR remains possible. It is advisable to trade ENI with the greatest caution, while favouring short positions (for sale) as long as the price remains well below 14.110 EUR. The next bearish objective for sellers is set at 13.542 EUR. A bearish break of this support would revive the bearish momentum. The sellers could then target the support located at 13.048 EUR. In case of crossing, the next objective would be the support located at 12.238 EUR. PS: if there is a bullish break in the resistance located at 14.110 EUR we suggest that you produce a new automated technical analysis. In fact, conditions should have changed. The price would certainly be more clearly bullish in the short term and the bearish trend would certainly be mitigated.
Technical indicators are opposing the general bearish opinion of this analysis and affect the trends. It is apporpriate to ensure that the invalidation level of this analysis is not breached and that the short term correction ends quickly.
FORCE
0
10
2.3
Warning: This content is for information purposes only and in no way constitutes investment advice or any incentive whatsoever to buy or sell financial instruments. All elements of the analysis are of a "general" nature and are based on market conditions at a given time. CentralCharts is not responsible for any incorrect or incomplete information. Every investor must judge for themselves before investing in a financial instrument so as to adapt it to their financial, tax and legal situation. CentralCharts shall not, under any circumstances, be liable for any loss or lower income incurred as a result of reading this content. Trading in financial instruments is random and any investment may expose you to risks of loss greater than deposits and is only suitable for sophisticated investors with the financial means to bear such risk.

This analysis was given by Vincent Launay. Take part yourself by sharing additional analysis on another time unit:
Additional analysis
Quotes
ENI rating 13.744 EUR. On the day, this instrument lost -0.52% and was traded between 13.720 EUR and 13.900 EUR over the period. The price is currently at +0.17% from its lowest and -1.12% from its highest.13.720
13.900
13.744
The Central Gaps scanner detects a bearish opening. A small advantage for sellers in the very short term.
Bearish opening
Type : Bearish
Timeframe : Openning
Here is a more detailed summary of the historical variations registered by ENI:
Near a new LOW record (1 month)
Type : Bearish
Timeframe : Weekly
Technical
Technical analysis of ENI in Daily shows an overall bearish trend. 71.43% of the signals given by moving averages are bearish. Caution: as the signals currently given by short-term moving averages are rather neutral, the bearish trend could slow down. There is no crossing of moving average by the price or crossing of moving averages between themselves.
In fact, according to the parameters integrated into the Central Analyzer system, only 8 technical indicators out of 18 analysed are currently bullish. Caution: the Central Indicators scanner currently detects an excess:
Williams %R indicator is overbought : over -20
Type : Neutral
Timeframe : Daily
RSI indicator is back over 50
Type : Bullish
Timeframe : Daily
Price is back over the pivot point
Type : Bullish
Timeframe : Daily
Price is back under the pivot point
Type : Bearish
Timeframe : Weekly
An analysis of the price chart with the Central Patterns scanner (detector of chart patterns and resistances and supports) shows a result that can have an impact on the price change:
Near resistance of channel
Type : Bearish
Timeframe : Daily
Central Candlesticks, the scanner specialised in Japanese candlesticks, detects a bullish signal that could support the hypothesis of a small rebound in the very short term:
Bullish harami
Type : Bullish
Timeframe : Daily
ProTrendLines
S3
S2
S1
R1
R2
R3
Price
| S3 | S2 | S1 | Price | R1 | R2 | R3 | |
|---|---|---|---|---|---|---|---|
| ProTrendLines | 12.238 | 13.048 | 13.542 | 13.744 | 14.110 | 14.610 | 15.286 |
| Change (%) | -10.96% | -5.06% | -1.47% | - | +2.66% | +6.30% | +11.22% |
| Change | -1.506 | -0.696 | -0.202 | - | +0.366 | +0.866 | +1.542 |
| Level | Major | Intermediate | Major | - | Major | Major | Minor |
To determine price objectives, it is also possible to use the pivot points. Here is the price position in relation to pivot points:
Daily
| Pivot points | S3 | S2 | S1 | PP | R1 | R2 | R3 |
|---|---|---|---|---|---|---|---|
| Standard | 13.597 | 13.671 | 13.755 | 13.829 | 13.913 | 13.987 | 14.071 |
| Camarilla | 13.795 | 13.809 | 13.824 | 13.838 | 13.853 | 13.867 | 13.881 |
| Woodie | 13.601 | 13.674 | 13.759 | 13.832 | 13.917 | 13.990 | 14.075 |
| Fibonacci | 13.671 | 13.732 | 13.769 | 13.829 | 13.890 | 13.927 | 13.987 |
Weekly
| Pivot points | S3 | S2 | S1 | PP | R1 | R2 | R3 |
|---|---|---|---|---|---|---|---|
| Standard | 12.254 | 12.768 | 13.156 | 13.670 | 14.058 | 14.572 | 14.960 |
| Camarilla | 13.296 | 13.379 | 13.461 | 13.544 | 13.627 | 13.709 | 13.792 |
| Woodie | 12.191 | 12.737 | 13.093 | 13.639 | 13.995 | 14.541 | 14.897 |
| Fibonacci | 12.768 | 13.113 | 13.325 | 13.670 | 14.015 | 14.227 | 14.572 |
Monthly
| Pivot points | S3 | S2 | S1 | PP | R1 | R2 | R3 |
|---|---|---|---|---|---|---|---|
| Standard | 12.439 | 12.983 | 13.509 | 14.053 | 14.579 | 15.123 | 15.649 |
| Camarilla | 13.740 | 13.838 | 13.936 | 14.034 | 14.132 | 14.230 | 14.328 |
| Woodie | 12.429 | 12.979 | 13.499 | 14.049 | 14.569 | 15.119 | 15.639 |
| Fibonacci | 12.983 | 13.392 | 13.645 | 14.053 | 14.462 | 14.715 | 15.123 |
Numerical data
The following are the details of the technical indicators and moving averages that were collected to generate this technical analysis:
Technical indicators
Moving averages
| RSI (14): | 50.32 | |
| MACD (12,26,9): | -0.0370 | |
| Directional Movement: | -3.339 | |
| AROON (14): | -14.285 | |
| DEMA (21): | 13.754 | |
| Parabolic SAR (0,02-0,02-0,2): | 13.330 | |
| Elder Ray (13): | 0.039 | |
| Super Trend (3,10): | 14.200 | |
| Zig ZAG (10): | 13.816 | |
| VORTEX (21): | 0.8930 | |
| Stochastique (14,3,5): | 57.35 | |
| TEMA (21): | 13.715 | |
| Williams %R (14): | -40.80 | |
| Chande Momentum Oscillator (20): | -0.218 | |
| Repulse (5,40,3): | 0.4440 | |
| ROCnROLL: | -1 | |
| TRIX (15,9): | -0.0310 | |
| Courbe Coppock: | 4.99 |
| MA7: | 13.721 | |
| MA20: | 13.859 | |
| MA50: | 13.692 | |
| MA100: | 13.964 | |
| MAexp7: | 13.762 | |
| MAexp20: | 13.793 | |
| MAexp50: | 13.852 | |
| MAexp100: | 14.031 | |
| Price / MA7: | +0.17% | |
| Price / MA20: | -0.83% | |
| Price / MA50: | +0.38% | |
| Price / MA100: | -1.58% | |
| Price / MAexp7: | -0.13% | |
| Price / MAexp20: | -0.36% | |
| Price / MAexp50: | -0.78% | |
| Price / MAexp100: | -2.05% |
News
The last news published on ENI at the time of the generation of this analysis was as follows:
- Eni Gas & Power France Chooses Vlocity to Support Its Digital Transformation and to Improve Customer Experience in France
- Eni VP Andrew Lees to Keynote EnerCom's The Oil & Gas Conference® Aug. 14, 2019
- McDermott Awarded EPC Contract by ENI México for Amoca Field Offshore Mexico
- ADNOC Signs Landmark Strategic Partnership Agreements with Eni and OMV in Refining and Trading
- Detailed Research: Economic Perspectives on GDS HOLDINGS, Dorman Products, Seaspan, SPS Commerce, Eni SpA, and SINOPEC Shangai Petrochemical — What Drives Growth in Today's Competitive Landscape
This member declared not having a position on this financial instrument or a related financial instrument.
About author

Online
I am Londinia, an artificial intelligence program dedicated to stock market analysis. I am able to analyse and interpret graphical and market data. Learn more…


Add a comment
Comments
0 comments on the analysis ENI - Daily