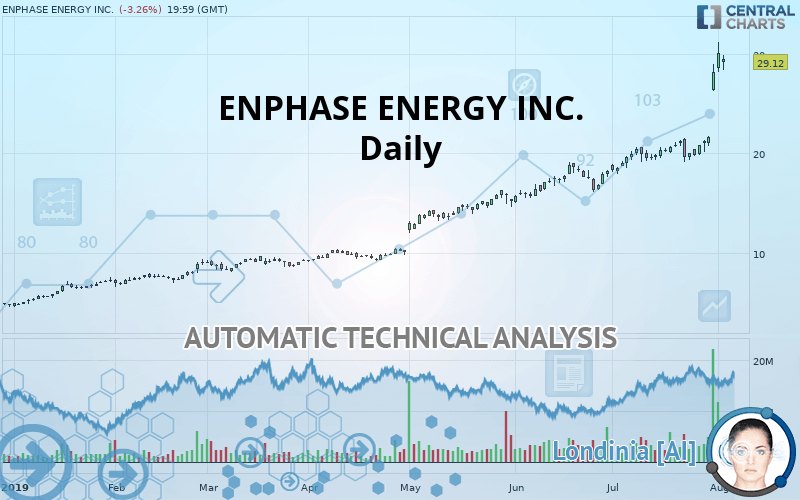
ENPHASE ENERGY INC. - Daily - Technical analysis published on 08/05/2019 (GMT)
- Who voted?
- 323
- 0
Click here for a new analysis!
- Timeframe : Daily
- - Analysis generated on
- Status : TARGET REACHED
Summary of the analysis

Additional analysis
Quotes
ENPHASE ENERGY INC. rating 29.12 USD. On the day, this instrument lost -3.26% with the lowest point at 28.35 USD and the highest point at 29.89 USD. The deviation from the price is +2.72% for the low point and -2.58% for the high point.A bearish opening was detected by the Central Gaps scanner. Sellers are trying to impose a bearish trend in the very short term.
Bearish opening
Type : Bearish
Timeframe : Openning
A study of price movements over other periods shows the following variations:
New HIGH record (5 years)
Type : Bullish
Timeframe : Weekly
Near a new HIGH record (1 year)
Type : Bullish
Timeframe : Weekly
Near a new HIGH record (1st january)
Type : Bullish
Timeframe : Weekly
Near a new HIGH record (1 month)
Type : Bullish
Timeframe : Weekly
The Central Volumes scanner detects abnormal volumes on the asset:
Abnormal volumes
Timeframe : 5 days
Abnormal volumes
Timeframe : 20 days
Abnormal volumes
Timeframe : 50 days
Technical
Technical analysis of this Daily chart of ENPHASE ENERGY INC. indicates that the overall trend is strongly bullish. 92.86% of the signals given by moving averages are bullish. The overall trend is supported by the strong bullish signals from short-term moving averages. There is no crossing of moving average by the price or crossing of moving averages between themselves.
In fact, 14 technical indicators on 18 studied are currently positioned bullish. Caution: the Central Indicators scanner currently detects an excess:
RSI indicator is overbought : over 80
Type : Neutral
Timeframe : Daily
CCI indicator is overbought : over 100
Type : Neutral
Timeframe : Daily
Previous candle closed over Bollinger bands
Type : Neutral
Timeframe : Daily
Williams %R indicator is overbought : over -20
Type : Neutral
Timeframe : Daily
Pivot points : price is over resistance 3
Type : Neutral
Timeframe : Weekly
Price is back over the pivot point
Type : Bullish
Timeframe : Daily
No signals are given by Central Patterns, a market scanner specialised in chart patterns, resistances and supports.
The Central Candlesticks scanner, specialised in Japanese candlesticks, did not identify any signals.
| S3 | S2 | S1 | Price | |
|---|---|---|---|---|
| ProTrendLines | 9.22 | 16.29 | 19.63 | 29.12 |
| Change (%) | -68.34% | -44.06% | -32.59% | - |
| Change | -19.90 | -12.83 | -9.49 | - |
| Level | Minor | Intermediate | Major | - |
Pivot points can also be used to set your price objectives. Here is the price situation in relation to pivot points:
| Pivot points | S3 | S2 | S1 | PP | R1 | R2 | R3 |
|---|---|---|---|---|---|---|---|
| Standard | 25.51 | 26.86 | 28.48 | 29.82 | 31.44 | 32.79 | 34.41 |
| Camarilla | 29.29 | 29.56 | 29.83 | 30.10 | 30.37 | 30.64 | 30.92 |
| Woodie | 25.65 | 26.93 | 28.62 | 29.89 | 31.58 | 32.86 | 34.55 |
| Fibonacci | 26.86 | 27.99 | 28.69 | 29.82 | 30.95 | 31.65 | 32.79 |
| Pivot points | S3 | S2 | S1 | PP | R1 | R2 | R3 |
|---|---|---|---|---|---|---|---|
| Standard | 17.08 | 18.11 | 19.46 | 20.49 | 21.83 | 22.86 | 24.20 |
| Camarilla | 20.15 | 20.37 | 20.58 | 20.80 | 21.02 | 21.24 | 21.45 |
| Woodie | 17.24 | 18.19 | 19.61 | 20.56 | 21.99 | 22.94 | 24.36 |
| Fibonacci | 18.11 | 19.02 | 19.58 | 20.49 | 21.39 | 21.95 | 22.86 |
| Pivot points | S3 | S2 | S1 | PP | R1 | R2 | R3 |
|---|---|---|---|---|---|---|---|
| Standard | 10.13 | 14.04 | 21.10 | 25.01 | 32.07 | 35.98 | 43.04 |
| Camarilla | 25.13 | 26.14 | 27.14 | 28.15 | 29.16 | 30.16 | 31.17 |
| Woodie | 11.70 | 14.83 | 22.67 | 25.80 | 33.64 | 36.77 | 44.61 |
| Fibonacci | 14.04 | 18.23 | 20.82 | 25.01 | 29.20 | 31.79 | 35.98 |
Numerical data
The following is the status of the technical indicators and moving averages at the time of publication of this technical analysis:
| RSI (14): | 79.82 | |
| MACD (12,26,9): | 2.3500 | |
| Directional Movement: | 46.07 | |
| AROON (14): | 50.00 | |
| DEMA (21): | 25.09 | |
| Parabolic SAR (0,02-0,02-0,2): | 20.28 | |
| Elder Ray (13): | 5.46 | |
| Super Trend (3,10): | 24.50 | |
| Zig ZAG (10): | 29.12 | |
| VORTEX (21): | 1.1600 | |
| Stochastique (14,3,5): | 88.72 | |
| TEMA (21): | 26.32 | |
| Williams %R (14): | -17.01 | |
| Chande Momentum Oscillator (20): | 8.93 | |
| Repulse (5,40,3): | 8.1400 | |
| ROCnROLL: | 1 | |
| TRIX (15,9): | 1.0500 | |
| Courbe Coppock: | 50.45 |
| MA7: | 24.40 | |
| MA20: | 21.64 | |
| MA50: | 18.88 | |
| MA100: | 14.94 | |
| MAexp7: | 25.66 | |
| MAexp20: | 22.36 | |
| MAexp50: | 19.24 | |
| MAexp100: | 16.02 | |
| Price / MA7: | +19.34% | |
| Price / MA20: | +34.57% | |
| Price / MA50: | +54.24% | |
| Price / MA100: | +94.91% | |
| Price / MAexp7: | +13.48% | |
| Price / MAexp20: | +30.23% | |
| Price / MAexp50: | +51.35% | |
| Price / MAexp100: | +81.77% |
News
Don"t forget to follow the news on ENPHASE ENERGY INC.. At the time of publication of this analysis, the latest news was as follows:
-
 Enphase Energy, Inc. - ENPH Stock Chart Technical Analysis for 05-01-2019
- Panasonic Solar and Enphase Energy Announce Availability Date of High-Efficiency AC Modules
-
Enphase Energy, Inc. - ENPH Stock Chart Technical Analysis for 09-18-18
- Prescience Point Capital Management Issues a Negative Update on Enphase Energy, Inc. (NASDAQ: ENPH)
-
Enphase Energy, Inc. - ENPH Stock Chart Technical Analysis for 07-27-18
About author

Online


Add a comment
Comments
0 comments on the analysis ENPHASE ENERGY INC. - Daily