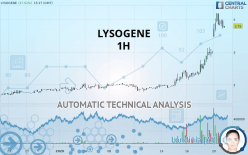
LYSOGENE - 1H - Technical analysis published on 01/20/2020 (GMT)
- Who voted?
- 241
- 0
Click here for a new analysis!
- Timeframe : 1H
- - Analysis generated on
- Status : TARGET REACHED

Summary of the analysis
Additional analysis
Quotes
LYSOGENE rating 3.79 EUR. The price has increased by +27.61% since the last closing and was traded between 3.46 EUR and 4.19 EUR over the period. The price is currently at +9.54% from its lowest and -9.55% from its highest.The Central Gaps scanner detects a bullish gap which is a sign that buyers have taken the lead in the very short term.
Opening Gap UP
Type : Bullish
Timeframe : Openning
So that you have an overall view of the price change, here is a table showing the variations over several periods:
New HIGH record (1 year)
Type : Bullish
Timeframe : Weekly
New HIGH record (1st january)
Type : Bullish
Timeframe : Weekly
New HIGH record (1 month)
Type : Bullish
Timeframe : Weekly
Abnormal volumes on LYSOGENE were detected by the Central Volumes scanner:
Abnormal volumes
Timeframe : 5 days
Abnormal volumes
Timeframe : 20 days
Abnormal volumes
Timeframe : 50 days
Technical
A technical analysis in 1H of this LYSOGENE chart shows a strongly bullish trend. 92.86% of the signals given by moving averages are bullish. This strongly bullish trend is supported by the strong bullish signals given by short-term moving averages. The Central Indicators market scanner currently does not detect any result that concerns moving averages.
An assessment of technical indicators shows a moderate bullish signal.
Caution: the Central Indicators scanner currently detects an excess:
RSI indicator is overbought : over 70
Type : Neutral
Timeframe : 1 hour
CCI indicator is overbought : over 100
Type : Neutral
Timeframe : 1 hour
RSI indicator: bearish divergence
Type : Bearish
Timeframe : 1 hour
Williams %R indicator is overbought : over -20
Type : Neutral
Timeframe : 1 hour
Pivot points : price is over resistance 2
Type : Neutral
Timeframe : 1 hour
Pivot points : price is over resistance 2
Type : Neutral
Timeframe : Weekly
The analysis of the price chart with Central Patterns scanners does not return any result.
The Central Candlesticks scanner, specialised in Japanese candlesticks, did not identify any signals.
| S3 | S2 | S1 | Price | R1 | R2 | |
|---|---|---|---|---|---|---|
| ProTrendLines | 2.23 | 2.42 | 3.30 | 3.79 | 4.98 | 5.91 |
| Change (%) | -41.16% | -36.04% | -12.93% | - | +31.50% | +55.94% |
| Change | -1.56 | -1.37 | -0.49 | - | +1.19 | +2.12 |
| Level | Minor | Major | Minor | - | Intermediate | Intermediate |
Pivot points can also be used to set your price objectives. Here is the price situation in relation to pivot points:
| Pivot points | S3 | S2 | S1 | PP | R1 | R2 | R3 |
|---|---|---|---|---|---|---|---|
| Standard | 1.68 | 2.01 | 2.49 | 2.82 | 3.30 | 3.63 | 4.11 |
| Camarilla | 2.75 | 2.82 | 2.90 | 2.97 | 3.04 | 3.12 | 3.19 |
| Woodie | 1.76 | 2.05 | 2.57 | 2.86 | 3.38 | 3.67 | 4.19 |
| Fibonacci | 2.01 | 2.32 | 2.51 | 2.82 | 3.13 | 3.32 | 3.63 |
| Pivot points | S3 | S2 | S1 | PP | R1 | R2 | R3 |
|---|---|---|---|---|---|---|---|
| Standard | 0.91 | 1.40 | 2.18 | 2.67 | 3.45 | 3.94 | 4.72 |
| Camarilla | 2.62 | 2.74 | 2.85 | 2.97 | 3.09 | 3.20 | 3.32 |
| Woodie | 1.07 | 1.47 | 2.34 | 2.74 | 3.61 | 4.01 | 4.88 |
| Fibonacci | 1.40 | 1.88 | 2.18 | 2.67 | 3.15 | 3.45 | 3.94 |
| Pivot points | S3 | S2 | S1 | PP | R1 | R2 | R3 |
|---|---|---|---|---|---|---|---|
| Standard | 1.09 | 1.26 | 1.54 | 1.71 | 1.99 | 2.16 | 2.44 |
| Camarilla | 1.69 | 1.73 | 1.77 | 1.82 | 1.86 | 1.90 | 1.94 |
| Woodie | 1.14 | 1.28 | 1.59 | 1.73 | 2.04 | 2.18 | 2.49 |
| Fibonacci | 1.26 | 1.43 | 1.53 | 1.71 | 1.88 | 1.98 | 2.16 |
Numerical data
The following is the status of the technical indicators and moving averages at the time of publication of this technical analysis:
| RSI (14): | 69.25 | |
| MACD (12,26,9): | 0.4200 | |
| Directional Movement: | 28.96 | |
| AROON (14): | 64.29 | |
| DEMA (21): | 3.83 | |
| Parabolic SAR (0,02-0,02-0,2): | 3.71 | |
| Elder Ray (13): | 0.24 | |
| Super Trend (3,10): | 3.24 | |
| Zig ZAG (10): | 3.80 | |
| VORTEX (21): | 1.1900 | |
| Stochastique (14,3,5): | 78.67 | |
| TEMA (21): | 4.04 | |
| Williams %R (14): | -24.38 | |
| Chande Momentum Oscillator (20): | 0.92 | |
| Repulse (5,40,3): | -1.7200 | |
| ROCnROLL: | 1 | |
| TRIX (15,9): | 2.1600 | |
| Courbe Coppock: | 99.19 |
| MA7: | 2.49 | |
| MA20: | 2.08 | |
| MA50: | 1.84 | |
| MA100: | 1.77 | |
| MAexp7: | 3.72 | |
| MAexp20: | 3.29 | |
| MAexp50: | 2.74 | |
| MAexp100: | 2.39 | |
| Price / MA7: | +52.21% | |
| Price / MA20: | +82.21% | |
| Price / MA50: | +105.98% | |
| Price / MA100: | +114.12% | |
| Price / MAexp7: | +1.88% | |
| Price / MAexp20: | +15.20% | |
| Price / MAexp50: | +38.32% | |
| Price / MAexp100: | +58.58% |
News
The latest news and videos published on LYSOGENE at the time of the analysis were as follows:
- Annual Report of the Liquidity Contract Signed by Lysogene with Gilbert Dupont
- Lysogene Announces the Publication of an Article in the Scientific Journal "Molecular Therapy Methods & Clinical Development” Demonstrating the Potential of Its Drug Candidate LYS-SAF302
- Lysogene Appoints Mr. Stéphane Durant des Aulnois as Chief Financial Officer
- Lysogene Reports First Half 2019 Financial Results and Provides Operational Update
- Lysogene Announces the Appointment of Carole Deffez as New Independent Board Director
About author

Online


Add a comment
Comments
0 comments on the analysis LYSOGENE - 1H