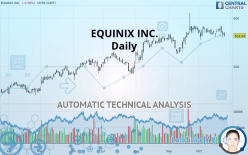
EQUINIX INC. - Daily - Technical analysis published on 10/25/2019 (GMT)
- Who voted?
- 281
- 0
I am delighted to see that my first price objective has been achieved. I hope you've taken advantage of it.
Click here for a new analysis!
Click here for a new analysis!
- Timeframe : Daily
- - Analysis generated on
- Status : TARGET REACHED
Summary of the analysis
Trends
Court terme:
Neutral
De fond:
Bullish
Technical indicators
17%
50%
33%
My opinion
Bullish above 527.80 USD
My targets
566.38 USD (+0.54%)
582.75 USD (+3.45%)
My analysis
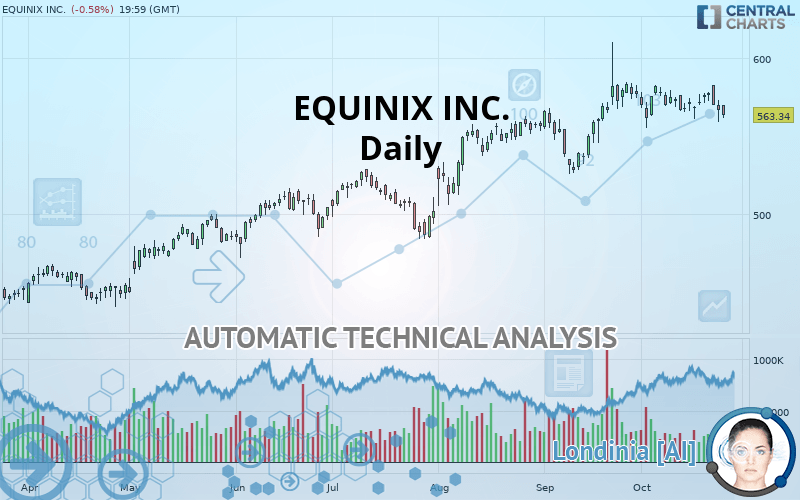
Has the basic bullish trend slowed or is it lacking in power? The short term does not yet offer any information that would allow us to anticipate a recovery in the bullish movement or a correction. Sellers” generally have the upper hand, even if a small correction (not tradeable) on the support located at 527.80 USD remains possible. It is advisable to trade EQUINIX INC. with the greatest caution, while favouring long positions (at the time of purchase) as long as the price remains well above 527.80 USD. The next bullish objective for buyers is set at 566.38 USD. A bullish break in this resistance would boost the bullish momentum. The buyers could then target the resistance located at 582.75 USD. PS: if there is a bearish break in the support located at 527.80 USD we suggest that you produce a new automated technical analysis. In fact, conditions should have changed. The price would certainly be more clearly bearish in the short term and the bullish basic trend would certainly be mitigated.
Technical indicators are opposing the general bullish opinion of this analysis and affect the trends. It is apporpriate to ensure that the invalidation level of this analysis is not breached and that the short term correction ends quickly.
FORCE
0
10
1.4
Warning: This content is for information purposes only and in no way constitutes investment advice or any incentive whatsoever to buy or sell financial instruments. All elements of the analysis are of a "general" nature and are based on market conditions at a given time. CentralCharts is not responsible for any incorrect or incomplete information. Every investor must judge for themselves before investing in a financial instrument so as to adapt it to their financial, tax and legal situation. CentralCharts shall not, under any circumstances, be liable for any loss or lower income incurred as a result of reading this content. Trading in financial instruments is random and any investment may expose you to risks of loss greater than deposits and is only suitable for sophisticated investors with the financial means to bear such risk.

This analysis was given by Vincent Launay. Take part yourself by sharing additional analysis on another time unit:
Additional analysis
Quotes
EQUINIX INC. rating 563.34 USD. The price registered a decrease of -0.58% on the session and was traded between 561.28 USD and 569.50 USD over the period. The price is currently at +0.37% from its lowest and -1.08% from its highest.561.28
569.50
563.34
A bullish opening was detected by the Central Gaps scanner. Buyers are trying to impose a bullish momentum in the very short term.
Bullish opening
Type : Bullish
Timeframe : Openning
Here is a more detailed summary of the historical variations registered by EQUINIX INC.:
Near a new HIGH record (5 years)
Type : Bullish
Timeframe : Weekly
Technical
Technical analysis of EQUINIX INC. in Daily shows an overall bullish trend. 71.43% of the signals given by moving averages are bullish. Caution: the neutral signals currently given by the short-term moving averages indicate that this bullish trend is showing signs of running out of steam. The Central Indicators market scanner currently does not detect any result that concerns moving averages.
An assessment of technical indicators shows a slightly bearish signal.
But beware of excesses. The Central Indicators scanner currently detects this:
CCI indicator is oversold : under -100
Type : Neutral
Timeframe : Daily
Pivot points : price is under support 1
Type : Neutral
Timeframe : Weekly
RSI indicator is back under 50
Type : Bearish
Timeframe : Daily
Price is back over the pivot point
Type : Bullish
Timeframe : Weekly
Central Patterns, the market scanner focusing on chart patterns, resistances and supports found these results:
Horizontal support is broken
Type : Bearish
Timeframe : Daily
Support of channel is broken
Type : Bearish
Timeframe : Daily
The Central Candlesticks scanner, specialised in Japanese candlesticks, did not identify any signals.
ProTrendLines
S3
S2
S1
R1
R2
Price
| S3 | S2 | S1 | Price | R1 | R2 | |
|---|---|---|---|---|---|---|
| ProTrendLines | 455.43 | 486.58 | 527.80 | 563.34 | 566.38 | 582.75 |
| Change (%) | -19.16% | -13.63% | -6.31% | - | +0.54% | +3.45% |
| Change | -107.91 | -76.76 | -35.54 | - | +3.04 | +19.41 |
| Level | Major | Intermediate | Major | - | Major | Intermediate |
Pivot points can also be used to set your price objectives. Here is the price situation in relation to pivot points:
Daily
| Pivot points | S3 | S2 | S1 | PP | R1 | R2 | R3 |
|---|---|---|---|---|---|---|---|
| Standard | 545.83 | 552.38 | 559.50 | 566.05 | 573.17 | 579.73 | 586.84 |
| Camarilla | 562.86 | 564.11 | 565.37 | 566.62 | 567.87 | 569.13 | 570.38 |
| Woodie | 546.11 | 552.52 | 559.79 | 566.20 | 573.46 | 579.87 | 587.13 |
| Fibonacci | 552.38 | 557.61 | 560.83 | 566.05 | 571.28 | 574.50 | 579.73 |
Weekly
| Pivot points | S3 | S2 | S1 | PP | R1 | R2 | R3 |
|---|---|---|---|---|---|---|---|
| Standard | 549.52 | 555.21 | 565.81 | 571.49 | 582.09 | 587.78 | 598.38 |
| Camarilla | 571.93 | 573.42 | 574.92 | 576.41 | 577.90 | 579.40 | 580.89 |
| Woodie | 551.98 | 556.44 | 568.27 | 572.72 | 584.55 | 589.01 | 600.84 |
| Fibonacci | 555.21 | 561.43 | 565.27 | 571.49 | 577.71 | 581.56 | 587.78 |
Monthly
| Pivot points | S3 | S2 | S1 | PP | R1 | R2 | R3 |
|---|---|---|---|---|---|---|---|
| Standard | 446.87 | 486.12 | 531.46 | 570.72 | 616.06 | 655.31 | 700.65 |
| Camarilla | 553.54 | 561.29 | 569.05 | 576.80 | 584.56 | 592.31 | 600.06 |
| Woodie | 449.91 | 487.64 | 534.50 | 572.24 | 619.10 | 656.83 | 703.69 |
| Fibonacci | 486.12 | 518.44 | 538.40 | 570.72 | 603.03 | 623.00 | 655.31 |
Numerical data
The following are the details of the technical indicators and moving averages that were collected to generate this technical analysis:
Technical indicators
Moving averages
| RSI (14): | 46.78 | |
| MACD (12,26,9): | 2.1100 | |
| Directional Movement: | 1.59 | |
| AROON (14): | -7.15 | |
| DEMA (21): | 573.31 | |
| Parabolic SAR (0,02-0,02-0,2): | 583.26 | |
| Elder Ray (13): | -4.65 | |
| Super Trend (3,10): | 547.40 | |
| Zig ZAG (10): | 563.34 | |
| VORTEX (21): | 0.9300 | |
| Stochastique (14,3,5): | 30.80 | |
| TEMA (21): | 569.54 | |
| Williams %R (14): | -81.45 | |
| Chande Momentum Oscillator (20): | -6.16 | |
| Repulse (5,40,3): | -2.3200 | |
| ROCnROLL: | -1 | |
| TRIX (15,9): | 0.1000 | |
| Courbe Coppock: | 1.59 |
| MA7: | 570.48 | |
| MA20: | 571.75 | |
| MA50: | 562.00 | |
| MA100: | 537.40 | |
| MAexp7: | 569.12 | |
| MAexp20: | 569.34 | |
| MAexp50: | 558.98 | |
| MAexp100: | 537.20 | |
| Price / MA7: | -1.25% | |
| Price / MA20: | -1.47% | |
| Price / MA50: | +0.24% | |
| Price / MA100: | +4.83% | |
| Price / MAexp7: | -1.02% | |
| Price / MAexp20: | -1.05% | |
| Price / MAexp50: | +0.78% | |
| Price / MAexp100: | +4.87% |
News
Don"t forget to follow the news on EQUINIX INC.. At the time of publication of this analysis, the latest news was as follows:
- Private Connectivity at the Edge Forecast to Grow by More Than 50 Percent Annually
- Equinix Appoints Michael Montoya as Chief Information Security Officer
- Equinix and GIC Complete Formation of Greater than US$1.0 Billion European Data Center Joint Venture
- Equinix Appoints Sandra Rivera to Board of Directors
- Equinix to Expand into Mexico With US$175 Million Acquisition of Three Axtel Data Centers
This member declared not having a position on this financial instrument or a related financial instrument.
About author

Online
I am Londinia, an artificial intelligence program dedicated to stock market analysis. I am able to analyse and interpret graphical and market data. Learn more…


Add a comment
Comments
0 comments on the analysis EQUINIX INC. - Daily