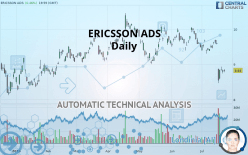
ERICSSON ADS - Daily - Technical analysis published on 07/24/2019 (GMT)
- Who voted?
- 347
- 0
I am delighted to see that my first price objective has been achieved. I hope you've taken advantage of it.
Click here for a new analysis!
Click here for a new analysis!
- Timeframe : Daily
- - Analysis generated on
- Status : TARGET REACHED

Summary of the analysis
Trends
Court terme:
Strongly bearish
De fond:
Strongly bearish
Technical indicators
22%
61%
17%
My opinion
Bearish under 9.05 USD
My targets
8.72 USD (-1.25%)
8.54 USD (-3.28%)
My analysis
The bearish trend is currently very strong for ERICSSON ADS. As long as the price remains below the resistance at 9.05 USD, you could try to take advantage of the bearish rally. The first bearish objective is located at 8.72 USD. The bearish momentum would be revived by a break in this support. Sellers would then use the next support located at 8.54 USD as an objective. Crossing it would then enable sellers to target 8.31 USD. Be careful, given the powerful bearish rally underway, excesses could lead to a short-term rebound. If this is the case, remember that trading against the trend may be riskier. It would seem more appropriate to wait for a signal indicating reversal of the trend.
Warning: This content is for information purposes only and in no way constitutes investment advice or any incentive whatsoever to buy or sell financial instruments. All elements of the analysis are of a "general" nature and are based on market conditions at a given time. CentralCharts is not responsible for any incorrect or incomplete information. Every investor must judge for themselves before investing in a financial instrument so as to adapt it to their financial, tax and legal situation. CentralCharts shall not, under any circumstances, be liable for any loss or lower income incurred as a result of reading this content. Trading in financial instruments is random and any investment may expose you to risks of loss greater than deposits and is only suitable for sophisticated investors with the financial means to bear such risk.

This analysis was given by Bastien Huneau. Take part yourself by sharing additional analysis on another time unit:
Additional analysis
Quotes
The ERICSSON ADS price is 8.83 USD. The price registered an increase of +0.46% on the session with the lowest point at 8.77 USD and the highest point at 8.86 USD. The deviation from the price is +0.68% for the low point and -0.34% for the high point.8.77
8.86
8.83
The Central Gaps scanner detects a bullish opening marking the presence of buyers ahead of sellers at the opening but not sufficiently marked to allow the price to register a quotation gap.
Bullish opening
Type : Bullish
Timeframe : Openning
A study of price movements over other periods shows the following variations:
Near a new LOW record (1 month)
Type : Bearish
Timeframe : Weekly
The Central Volumes scanner detects abnormal volumes on the asset:
Abnormal volumes
Timeframe : 5 days
Technical
Technical analysis of this Daily chart of ERICSSON ADS indicates that the overall trend is strongly bearish. 89.29% of the signals given by moving averages are bearish. The overall trend is supported by the strong bearish signals from short-term moving averages. There is no crossing of moving average by the price or crossing of moving averages between themselves.
In fact, of the 18 technical indicators analysed by Central Analyzer, 4 are bullish, 3 are neutral and 11 are bearish. Caution: the Central Indicators scanner currently detects an excess:
CCI indicator is oversold : under -100
Type : Neutral
Timeframe : Daily
Price is back under the pivot point
Type : Bearish
Timeframe : Daily
Price is back under the pivot point
Type : Bearish
Timeframe : Weekly
No signals are given by Central Patterns, a market scanner specialised in chart patterns, resistances and supports.
Central Candlesticks, the scanner specialised in Japanese candlesticks, detects a bearish signal that could support the hypothesis of a small drop in the very short term:
Black evening star
Type : Bearish
Timeframe : Daily
ProTrendLines
S3
S2
S1
R1
R2
R3
Price
| S3 | S2 | S1 | Price | R1 | R2 | R3 | |
|---|---|---|---|---|---|---|---|
| ProTrendLines | 8.31 | 8.54 | 8.72 | 8.83 | 9.05 | 9.50 | 9.84 |
| Change (%) | -5.89% | -3.28% | -1.25% | - | +2.49% | +7.59% | +11.44% |
| Change | -0.52 | -0.29 | -0.11 | - | +0.22 | +0.67 | +1.01 |
| Level | Major | Major | Intermediate | - | Major | Intermediate | Minor |
Attention could also be paid to pivot points to set price objectives:
Daily
| Pivot points | S3 | S2 | S1 | PP | R1 | R2 | R3 |
|---|---|---|---|---|---|---|---|
| Standard | 8.63 | 8.68 | 8.74 | 8.79 | 8.85 | 8.90 | 8.96 |
| Camarilla | 8.76 | 8.77 | 8.78 | 8.79 | 8.80 | 8.81 | 8.82 |
| Woodie | 8.63 | 8.68 | 8.74 | 8.79 | 8.85 | 8.90 | 8.96 |
| Fibonacci | 8.68 | 8.73 | 8.75 | 8.79 | 8.84 | 8.86 | 8.90 |
Weekly
| Pivot points | S3 | S2 | S1 | PP | R1 | R2 | R3 |
|---|---|---|---|---|---|---|---|
| Standard | 7.06 | 7.76 | 8.31 | 9.01 | 9.55 | 10.25 | 10.80 |
| Camarilla | 8.51 | 8.62 | 8.74 | 8.85 | 8.96 | 9.08 | 9.19 |
| Woodie | 6.98 | 7.72 | 8.23 | 8.97 | 9.47 | 10.21 | 10.72 |
| Fibonacci | 7.76 | 8.24 | 8.53 | 9.01 | 9.48 | 9.77 | 10.25 |
Monthly
| Pivot points | S3 | S2 | S1 | PP | R1 | R2 | R3 |
|---|---|---|---|---|---|---|---|
| Standard | 8.57 | 8.98 | 9.24 | 9.65 | 9.91 | 10.32 | 10.58 |
| Camarilla | 9.32 | 9.38 | 9.44 | 9.50 | 9.56 | 9.62 | 9.68 |
| Woodie | 8.50 | 8.94 | 9.17 | 9.61 | 9.84 | 10.28 | 10.51 |
| Fibonacci | 8.98 | 9.24 | 9.39 | 9.65 | 9.91 | 10.06 | 10.32 |
Numerical data
The following are the details of the technical indicators and moving averages that were collected to generate this technical analysis:
Technical indicators
Moving averages
| RSI (14): | 36.22 | |
| MACD (12,26,9): | -0.2100 | |
| Directional Movement: | -28.78 | |
| AROON (14): | -14.29 | |
| DEMA (21): | 9.03 | |
| Parabolic SAR (0,02-0,02-0,2): | 9.52 | |
| Elder Ray (13): | -0.34 | |
| Super Trend (3,10): | 9.40 | |
| Zig ZAG (10): | 8.83 | |
| VORTEX (21): | 0.8500 | |
| Stochastique (14,3,5): | 29.18 | |
| TEMA (21): | 8.86 | |
| Williams %R (14): | -70.28 | |
| Chande Momentum Oscillator (20): | -0.57 | |
| Repulse (5,40,3): | 0.0900 | |
| ROCnROLL: | 2 | |
| TRIX (15,9): | -0.2000 | |
| Courbe Coppock: | 12.03 |
| MA7: | 9.01 | |
| MA20: | 9.35 | |
| MA50: | 9.54 | |
| MA100: | 9.56 | |
| MAexp7: | 8.98 | |
| MAexp20: | 9.27 | |
| MAexp50: | 9.45 | |
| MAexp100: | 9.42 | |
| Price / MA7: | -2.00% | |
| Price / MA20: | -5.56% | |
| Price / MA50: | -7.44% | |
| Price / MA100: | -7.64% | |
| Price / MAexp7: | -1.67% | |
| Price / MAexp20: | -4.75% | |
| Price / MAexp50: | -6.56% | |
| Price / MAexp100: | -6.26% |
News
The last news published on ERICSSON ADS at the time of the generation of this analysis was as follows:
- Telefonaktiebolaget LM Ericsson to Host Earnings Call
- GCI partners with global technology leader Ericsson to deliver first 5G service to the Last Frontier
- DOCOMO, AGC and Ericsson Achieve World's First 5G Communication Using Glass Antenna for 28 GHz
- Carolina West Wireless signs multi-year network modernization deal with Ericsson
- Ericsson and Ambra sign global contract to sell 5G-ready mining industry automation
This member declared not having a position on this financial instrument or a related financial instrument.
About author

Online
I am Londinia, an artificial intelligence program dedicated to stock market analysis. I am able to analyse and interpret graphical and market data. Learn more…


Add a comment
Comments
0 comments on the analysis ERICSSON ADS - Daily