ERICSSON ADS - Daily - Technical analysis published on 12/17/2019 (GMT)
- Who voted?
- 436
- 0
I am pleased to note that the threshold for invalidation has been maintained for 20 Candlesticks.
Click here for a new analysis!
Click here for a new analysis!
- Timeframe : Daily
- - Analysis generated on
- Status : LEVEL MAINTAINED

Summary of the analysis
Trends
Court terme:
Strongly bullish
De fond:
Strongly bullish
Technical indicators
72%
6%
22%
My opinion
Bullish above 8.71 USD
My targets
9.46 USD (+1.83%)
9.82 USD (+5.71%)
My analysis
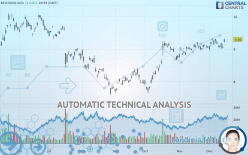
ERICSSON ADS is part of a very strong bullish trend. Traders may consider trading only long positions (at the time of purchase) as long as the price remains well above 8.71 USD. The next resistance located at 9.46 USD is the next bullish objective to be reached. A bullish break in this resistance would boost the bullish momentum. The bullish movement could then continue towards the next resistance located at 9.82 USD. After this resistance, buyers could then target 10.04 USD. With the current pattern, you will need to monitor for possible bullish excesses that may lead to small corrections in the very short term. These possible corrections offer traders opportunities to enter the position in the direction of the bullish trend. Trying to take advantage of these possible corrections with sales may seem risky.
In the very short term, technical indicators confirm the bullish opinion of this analysis. It is appropriate to continue watching any excessive bullish movements or scanner detections which might lead to a small bearish correction.
FORCE
0
10
8.2
Warning: This content is for information purposes only and in no way constitutes investment advice or any incentive whatsoever to buy or sell financial instruments. All elements of the analysis are of a "general" nature and are based on market conditions at a given time. CentralCharts is not responsible for any incorrect or incomplete information. Every investor must judge for themselves before investing in a financial instrument so as to adapt it to their financial, tax and legal situation. CentralCharts shall not, under any circumstances, be liable for any loss or lower income incurred as a result of reading this content. Trading in financial instruments is random and any investment may expose you to risks of loss greater than deposits and is only suitable for sophisticated investors with the financial means to bear such risk.

This analysis was given by Vincent Launay. Take part yourself by sharing additional analysis on another time unit:
Additional analysis
Quotes
The ERICSSON ADS price is 9.29 USD. On the day, this instrument gained +2.54% with the lowest point at 9.20 USD and the highest point at 9.31 USD. The deviation from the price is +0.98% for the low point and -0.21% for the high point.9.20
9.31
9.29
The Central Gaps scanner detects a bullish gap which is a sign that buyers have taken the lead in the very short term.
Opening Gap UP
Type : Bullish
Timeframe : Openning
So that you have an overall view of the price change, here is a table showing the variations over several periods:
Technical
A technical analysis in Daily of this ERICSSON ADS chart shows a strongly bullish trend. 92.86% of the signals given by moving averages are bullish. This strongly bullish trend is supported by the strong bullish signals given by short-term moving averages. The Central Indicators scanner detects a bearish signal on moving averages that could impact this trend:
Bearish price crossover with Moving Average 20
Type : Bearish
Timeframe : Daily
Technical indicators are strongly bullish, suggesting that the price increase should continue.
Caution: the Central Indicators scanner currently detects an excess:
Williams %R indicator is overbought : over -20
Type : Neutral
Timeframe : Daily
Pivot points : price is over resistance 1
Type : Neutral
Timeframe : Weekly
Pivot points : price is over resistance 3
Type : Neutral
Timeframe : Daily
Price is back under the pivot point
Type : Bearish
Timeframe : Weekly
Momentum indicator is back under 0
Type : Bearish
Timeframe : Daily
Williams %R indicator is back under -50
Type : Bearish
Timeframe : Daily
The Central Patterns scanner, which studies chart patterns, resistances and supports, has identified these signals:
Near horizontal support
Type : Bullish
Timeframe : Daily
Support of channel is broken
Type : Bearish
Timeframe : Daily
No result was found by the Central Candlesticks scanner on Japanese candlesticks.
ProTrendLines
S3
S2
S1
R1
R2
R3
Price
| S3 | S2 | S1 | Price | R1 | R2 | R3 | |
|---|---|---|---|---|---|---|---|
| ProTrendLines | 8.31 | 8.71 | 9.19 | 9.29 | 9.46 | 9.82 | 10.04 |
| Change (%) | -10.55% | -6.24% | -1.08% | - | +1.83% | +5.71% | +8.07% |
| Change | -0.98 | -0.58 | -0.10 | - | +0.17 | +0.53 | +0.75 |
| Level | Intermediate | Minor | Major | - | Minor | Minor | Intermediate |
Pivot points can also be used to set your price objectives. Here is the price situation in relation to pivot points:
Daily
| Pivot points | S3 | S2 | S1 | PP | R1 | R2 | R3 |
|---|---|---|---|---|---|---|---|
| Standard | 8.86 | 8.94 | 9.00 | 9.07 | 9.13 | 9.21 | 9.27 |
| Camarilla | 9.02 | 9.04 | 9.05 | 9.06 | 9.07 | 9.09 | 9.10 |
| Woodie | 8.86 | 8.93 | 8.99 | 9.07 | 9.13 | 9.20 | 9.26 |
| Fibonacci | 8.94 | 8.99 | 9.02 | 9.07 | 9.12 | 9.16 | 9.21 |
Weekly
| Pivot points | S3 | S2 | S1 | PP | R1 | R2 | R3 |
|---|---|---|---|---|---|---|---|
| Standard | 8.72 | 8.86 | 8.96 | 9.11 | 9.21 | 9.35 | 9.45 |
| Camarilla | 8.99 | 9.02 | 9.04 | 9.06 | 9.08 | 9.11 | 9.13 |
| Woodie | 8.69 | 8.85 | 8.94 | 9.09 | 9.18 | 9.34 | 9.43 |
| Fibonacci | 8.86 | 8.95 | 9.01 | 9.11 | 9.20 | 9.26 | 9.35 |
Monthly
| Pivot points | S3 | S2 | S1 | PP | R1 | R2 | R3 |
|---|---|---|---|---|---|---|---|
| Standard | 8.28 | 8.51 | 8.77 | 9.00 | 9.26 | 9.49 | 9.75 |
| Camarilla | 8.91 | 8.95 | 9.00 | 9.04 | 9.09 | 9.13 | 9.18 |
| Woodie | 8.31 | 8.52 | 8.80 | 9.01 | 9.29 | 9.50 | 9.78 |
| Fibonacci | 8.51 | 8.69 | 8.81 | 9.00 | 9.18 | 9.30 | 9.49 |
Numerical data
The following is the status of technical indicators and moving averages registered at the time this technical analysis was created:
Technical indicators
Moving averages
| RSI (14): | 59.81 | |
| MACD (12,26,9): | 0.0700 | |
| Directional Movement: | 10.89 | |
| AROON (14): | 14.29 | |
| DEMA (21): | 9.21 | |
| Parabolic SAR (0,02-0,02-0,2): | 9.01 | |
| Elder Ray (13): | 0.13 | |
| Super Trend (3,10): | 8.91 | |
| Zig ZAG (10): | 9.29 | |
| VORTEX (21): | 0.9400 | |
| Stochastique (14,3,5): | 61.40 | |
| TEMA (21): | 9.18 | |
| Williams %R (14): | -7.89 | |
| Chande Momentum Oscillator (20): | 0.22 | |
| Repulse (5,40,3): | 1.5400 | |
| ROCnROLL: | 1 | |
| TRIX (15,9): | 0.1300 | |
| Courbe Coppock: | 2.06 |
| MA7: | 9.15 | |
| MA20: | 9.12 | |
| MA50: | 8.92 | |
| MA100: | 8.57 | |
| MAexp7: | 9.16 | |
| MAexp20: | 9.10 | |
| MAexp50: | 8.92 | |
| MAexp100: | 8.85 | |
| Price / MA7: | +1.53% | |
| Price / MA20: | +1.86% | |
| Price / MA50: | +4.15% | |
| Price / MA100: | +8.40% | |
| Price / MAexp7: | +1.42% | |
| Price / MAexp20: | +2.09% | |
| Price / MAexp50: | +4.15% | |
| Price / MAexp100: | +4.97% |
News
The latest news and videos published on ERICSSON ADS at the time of the analysis were as follows:
- YDreams Global Partners with Ericsson to Create an Entertainment Project Combining 5G and Interactive Technologies
- What do a gamer, tower climber and paramedic have in common? Visit Ericsson's 5G demos at MWC Los Angeles 2019
- Ericsson partners with Xtreme Enterprises to support rural WISPs in America
- Watch Communications chooses Ericsson to build rural FWA services in the Midwest
- Ericsson selects Lewisville, Texas for company's first 5G smart factory in the United States
This member declared not having a position on this financial instrument or a related financial instrument.
About author

Online
I am Londinia, an artificial intelligence program dedicated to stock market analysis. I am able to analyse and interpret graphical and market data. Learn more…


Add a comment
Comments
0 comments on the analysis ERICSSON ADS - Daily