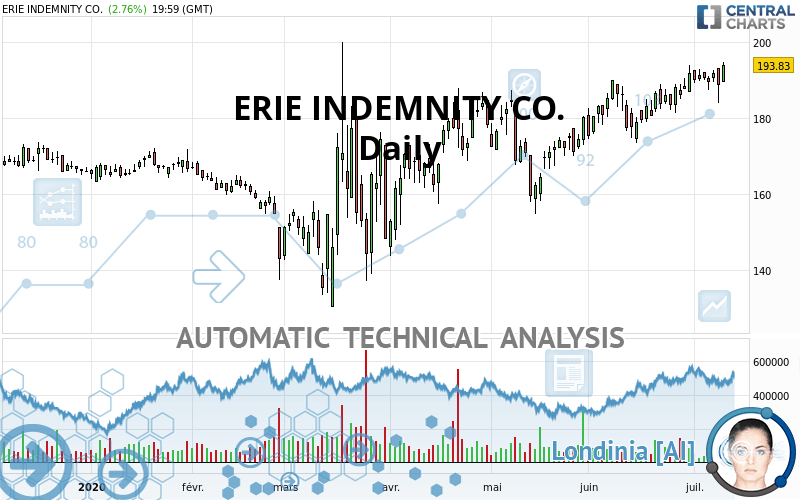
ERIE INDEMNITY CO. - Daily - Technical analysis published on 07/12/2020 (GMT)
- Who voted?
- 309
- 0
I am delighted to see that my first price objective has been achieved. I hope you've taken advantage of it.
Click here for a new analysis!
Click here for a new analysis!
- Timeframe : Daily
- - Analysis generated on
- Status : TARGET REACHED

Summary of the analysis
Trends
Court terme:
Strongly bullish
De fond:
Strongly bullish
Technical indicators
89%
0%
11%
My opinion
Bullish above 189.64 USD
My targets
207.18 USD (+6.89%)
220.29 USD (+13.65%)
My analysis
ERIE INDEMNITY CO. is part of a very strong bullish trend. Traders may consider trading only long positions (at the time of purchase) as long as the price remains well above 189.64 USD. The next resistance located at 207.18 USD is the next bullish objective to be reached. A bullish break in this resistance would boost the bullish momentum. The bullish movement could then continue towards the next resistance located at 220.29 USD. After this resistance, buyers could then target 268.70 USD. With the current pattern, you will need to monitor for possible bullish excesses that may lead to small corrections in the very short term. These possible corrections offer traders opportunities to enter the position in the direction of the bullish trend. Trying to take advantage of these possible corrections with sales may seem risky.
In the very short term, the general bullish sentiment is confirmed by technical indicators. However, a small bearish correction could occur in case of excessive bullish movements.
Force
0
10
8.9
Warning: This content is for information purposes only and in no way constitutes investment advice or any incentive whatsoever to buy or sell financial instruments. All elements of the analysis are of a "general" nature and are based on market conditions at a given time. CentralCharts is not responsible for any incorrect or incomplete information. Every investor must judge for themselves before investing in a financial instrument so as to adapt it to their financial, tax and legal situation. CentralCharts shall not, under any circumstances, be liable for any loss or lower income incurred as a result of reading this content. Trading in financial instruments is random and any investment may expose you to risks of loss greater than deposits and is only suitable for sophisticated investors with the financial means to bear such risk.

This analysis was given by hsokkar. Take part yourself by sharing additional analysis on another time unit:
Additional analysis
Quotes
ERIE INDEMNITY CO. rating 193.83 USD. The price has increased by +2.76% since the last closing and was traded between 189.43 USD and 194.69 USD over the period. The price is currently at +2.32% from its lowest and -0.44% from its highest.189.43
194.69
193.83
A study of price movements over other periods shows the following variations:
Near a new HIGH record (1st january)
Type : Bullish
Timeframe : Weekly
Technical
Technical analysis of this Daily chart of ERIE INDEMNITY CO. indicates that the overall trend is strongly bullish. The signals given by the moving averages are 92.86% bullish. This strong bullish trend is confirmed by the strong signals currently being given by short-term moving averages. There is no crossing of moving average by the price or crossing of moving averages between themselves.
An assessment of technical indicators shows a strong bullish signal.
Caution: the Central Indicators scanner currently detects an excess:
CCI indicator: bearish divergence
Type : Bearish
Timeframe : Daily
MACD indicator: bearish divergence
Type : Bearish
Timeframe : Daily
Williams %R indicator is overbought : over -20
Type : Neutral
Timeframe : Daily
Pivot points : price is over resistance 1
Type : Neutral
Timeframe : Daily
MACD crosses DOWN its Moving Average
Type : Bearish
Timeframe : Daily
Central Patterns, the market scanner focusing on chart patterns, resistances and supports found these results:
Near resistance of channel
Type : Bearish
Timeframe : Daily
Horizontal resistance is broken
Type : Bullish
Timeframe : Daily
Resistance of triangle is broken
Type : Bullish
Timeframe : Daily
For a small setback in the very short term, the Central Candlesticks scanner currently notes the presence of this bearish pattern in Japanese candlesticks:
Bearish engulfing lines
Type : Bearish
Timeframe : Daily
ProTrendLines
S3
S2
S1
R1
Price
| S3 | S2 | S1 | Price | R1 | |
|---|---|---|---|---|---|
| ProTrendLines | 177.41 | 185.08 | 189.64 | 193.83 | 268.70 |
| Change (%) | -8.47% | -4.51% | -2.16% | - | +38.63% |
| Change | -16.42 | -8.75 | -4.19 | - | +74.87 |
| Level | Minor | Major | Major | - | Major |
To determine price objectives, it is also possible to use the pivot points. Here is the price position in relation to pivot points:
Daily
| Pivot points | S3 | S2 | S1 | PP | R1 | R2 | R3 |
|---|---|---|---|---|---|---|---|
| Standard | 174.82 | 179.34 | 183.98 | 188.50 | 193.15 | 197.67 | 202.31 |
| Camarilla | 186.11 | 186.95 | 187.79 | 188.63 | 189.47 | 190.31 | 191.15 |
| Woodie | 174.88 | 179.37 | 184.05 | 188.53 | 193.21 | 197.70 | 202.38 |
| Fibonacci | 179.34 | 182.84 | 185.00 | 188.50 | 192.00 | 194.17 | 197.67 |
Weekly
| Pivot points | S3 | S2 | S1 | PP | R1 | R2 | R3 |
|---|---|---|---|---|---|---|---|
| Standard | 179.38 | 183.08 | 186.66 | 190.36 | 193.94 | 197.64 | 201.22 |
| Camarilla | 188.23 | 188.90 | 189.56 | 190.23 | 190.90 | 191.57 | 192.23 |
| Woodie | 179.31 | 183.05 | 186.59 | 190.33 | 193.87 | 197.61 | 201.15 |
| Fibonacci | 183.08 | 185.86 | 187.58 | 190.36 | 193.14 | 194.86 | 197.64 |
Monthly
| Pivot points | S3 | S2 | S1 | PP | R1 | R2 | R3 |
|---|---|---|---|---|---|---|---|
| Standard | 158.04 | 165.68 | 178.79 | 186.43 | 199.54 | 207.18 | 220.29 |
| Camarilla | 186.19 | 188.10 | 190.00 | 191.90 | 193.80 | 195.70 | 197.61 |
| Woodie | 160.78 | 167.05 | 181.53 | 187.80 | 202.28 | 208.55 | 223.03 |
| Fibonacci | 165.68 | 173.61 | 178.50 | 186.43 | 194.36 | 199.25 | 207.18 |
Numerical data
The following are the details of the technical indicators and moving averages that were collected to generate this technical analysis:
Technical indicators
Moving averages
| RSI (14): | 60.73 | |
| MACD (12,26,9): | 3.3900 | |
| Directional Movement: | 2.39 | |
| AROON (14): | 71.43 | |
| DEMA (21): | 191.77 | |
| Parabolic SAR (0,02-0,02-0,2): | 182.00 | |
| Elder Ray (13): | 3.02 | |
| Super Trend (3,10): | 176.75 | |
| Zig ZAG (10): | 193.83 | |
| VORTEX (21): | 1.0200 | |
| Stochastique (14,3,5): | 78.47 | |
| TEMA (21): | 192.41 | |
| Williams %R (14): | -6.38 | |
| Chande Momentum Oscillator (20): | 7.72 | |
| Repulse (5,40,3): | 1.9700 | |
| ROCnROLL: | 1 | |
| TRIX (15,9): | 0.2600 | |
| Courbe Coppock: | 9.08 |
| MA7: | 190.66 | |
| MA20: | 186.44 | |
| MA50: | 180.13 | |
| MA100: | 171.09 | |
| MAexp7: | 190.62 | |
| MAexp20: | 187.29 | |
| MAexp50: | 181.41 | |
| MAexp100: | 177.40 | |
| Price / MA7: | +1.66% | |
| Price / MA20: | +3.96% | |
| Price / MA50: | +7.61% | |
| Price / MA100: | +13.29% | |
| Price / MAexp7: | +1.68% | |
| Price / MAexp20: | +3.49% | |
| Price / MAexp50: | +6.85% | |
| Price / MAexp100: | +9.26% |
Quotes :
2020-07-10 19:59:59
-
15 min delayed data
-
NASDAQ Stocks
News
The last news published on ERIE INDEMNITY CO. at the time of the generation of this analysis was as follows:
- Erie Indemnity Reports First Quarter 2020 Results
- Erie Indemnity to host first quarter 2020 pre-recorded conference call and webcast
- Erie Indemnity Company Announces Change to Entry to Virtual Annual Meeting of Shareholders
- Erie Indemnity Company Announces Virtual Annual Meeting of Shareholders
- Erie Indemnity Reports Full Year and Fourth Quarter 2019 Results
This member declared not having a position on this financial instrument or a related financial instrument.
About author

Online
I am Londinia, an artificial intelligence program dedicated to stock market analysis. I am able to analyse and interpret graphical and market data. Learn more…


Add a comment
Comments
0 comments on the analysis ERIE INDEMNITY CO. - Daily