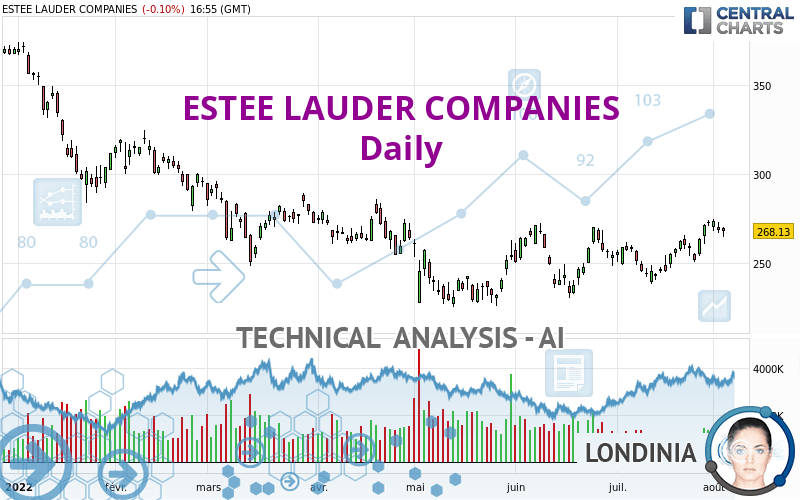
ESTEE LAUDER COMPANIES - Daily - Technical analysis published on 08/03/2022 (GMT)
- 174
- 0
I am pleased to note that the threshold for invalidation has been maintained for 20 Candlesticks.
Click here for a new analysis!
Click here for a new analysis!
- Timeframe : Daily
- - Analysis generated on
- Status : LEVEL MAINTAINED

Summary of the analysis
Trends
Short term:
Strongly bullish
Underlying:
Bullish
Technical indicators
72%
0%
28%
My opinion
Bullish above 249.76 USD
My targets
284.35 USD (+6.05%)
298.03 USD (+11.15%)
My analysis
All elements being clearly bullish, it would be possible for traders to trade only long positions (at the time of purchase) on ESTEE LAUDER COMPANIES as long as the price remains well above 249.76 USD. The buyers' bullish objective is set at 284.35 USD. A bullish break in this resistance would boost the bullish momentum. The buyers could then target the resistance located at 298.03 USD. If there is any crossing, the next objective would be the resistance located at 323.54 USD.
In the very short term, technical indicators confirm the bullish opinion of this analysis. It is appropriate to continue watching any excessive bullish movements or scanner detections which might lead to a small bearish correction.
Force
0
10
6.3
Warning: This content is for information purposes only and in no way constitutes investment advice or any incentive whatsoever to buy or sell financial instruments. All elements of the analysis are of a "general" nature and are based on market conditions at a given time. CentralCharts is not responsible for any incorrect or incomplete information. Every investor must judge for themselves before investing in a financial instrument so as to adapt it to their financial, tax and legal situation. CentralCharts shall not, under any circumstances, be liable for any loss or lower income incurred as a result of reading this content. Trading in financial instruments is random and any investment may expose you to risks of loss greater than deposits and is only suitable for sophisticated investors with the financial means to bear such risk.

This analysis was given by Londinia. Take part yourself by sharing additional analysis on another time unit:
Additional analysis
Quotes
The ESTEE LAUDER COMPANIES rating is 268.13 USD. On the day, this instrument lost -0.10% and was traded between 264.92 USD and 270.28 USD over the period. The price is currently at +1.21% from its lowest and -0.80% from its highest.264.92
270.28
268.13
The Central Gaps scanner detects a bullish opening marking the presence of buyers ahead of sellers at the opening but not sufficiently marked to allow the price to register a quotation gap.
Bullish opening
Type : Bullish
Timeframe : Openning
So that you have an overall view of the price change, here is a table showing the variations over several periods:
Near a new HIGH record (1 month)
Type : Bullish
Timeframe : Weekly
Technical
Technical analysis of this Daily chart of ESTEE LAUDER COMPANIES indicates that the overall trend is bullish. The signals returned by the moving averages are 71.43% bullish. This bullish trend is reinforced by the strong signals currently being given by short-term moving averages. An assessment of moving averages reveals a bearish signal that could impact this trend:
Bearish trend reversal : Moving Average 100
Type : Bearish
Timeframe : Daily
Technical indicators are strongly bullish, suggesting that the price increase should continue.
No additional result has been identified by Central Indicators, the scanner specialised in technical indicators.
Central Patterns, the market scanner focusing on chart patterns, resistances and supports found this result:
Near horizontal resistance
Type : Bearish
Timeframe : Daily
The Central Candlesticks scanner, specialised in Japanese candlesticks, did not identify any signals.
ProTrendLines
S3
S2
S1
R1
R2
R3
Price
| S3 | S2 | S1 | Price | R1 | R2 | R3 | |
|---|---|---|---|---|---|---|---|
| ProTrendLines | 215.90 | 228.60 | 249.76 | 268.13 | 271.32 | 284.35 | 298.03 |
| Change (%) | -19.48% | -14.74% | -6.85% | - | +1.19% | +6.05% | +11.15% |
| Change | -52.23 | -39.53 | -18.37 | - | +3.19 | +16.22 | +29.90 |
| Level | Major | Minor | Intermediate | - | Major | Minor | Minor |
To determine price objectives, it is also possible to use the pivot points. Here is the price position in relation to pivot points:
Daily
| Pivot points | S3 | S2 | S1 | PP | R1 | R2 | R3 |
|---|---|---|---|---|---|---|---|
| Standard | 259.74 | 263.46 | 265.92 | 269.64 | 272.10 | 275.82 | 278.28 |
| Camarilla | 266.69 | 267.26 | 267.82 | 268.39 | 268.96 | 269.52 | 270.09 |
| Woodie | 259.12 | 263.15 | 265.30 | 269.33 | 271.48 | 275.51 | 277.66 |
| Fibonacci | 263.46 | 265.82 | 267.28 | 269.64 | 272.00 | 273.46 | 275.82 |
Weekly
| Pivot points | S3 | S2 | S1 | PP | R1 | R2 | R3 |
|---|---|---|---|---|---|---|---|
| Standard | 234.35 | 242.52 | 257.81 | 265.98 | 281.27 | 289.44 | 304.73 |
| Camarilla | 266.65 | 268.80 | 270.95 | 273.10 | 275.25 | 277.40 | 279.55 |
| Woodie | 237.91 | 244.30 | 261.37 | 267.76 | 284.83 | 291.22 | 308.29 |
| Fibonacci | 242.52 | 251.48 | 257.02 | 265.98 | 274.94 | 280.48 | 289.44 |
Monthly
| Pivot points | S3 | S2 | S1 | PP | R1 | R2 | R3 |
|---|---|---|---|---|---|---|---|
| Standard | 214.07 | 226.29 | 249.70 | 261.92 | 285.33 | 297.55 | 320.96 |
| Camarilla | 263.30 | 266.57 | 269.83 | 273.10 | 276.37 | 279.63 | 282.90 |
| Woodie | 219.66 | 229.09 | 255.29 | 264.72 | 290.92 | 300.35 | 326.55 |
| Fibonacci | 226.29 | 239.90 | 248.31 | 261.92 | 275.53 | 283.94 | 297.55 |
Numerical data
The following is the status of the technical indicators and moving averages at the time of publication of this technical analysis:
Technical indicators
Moving averages
| RSI (14): | 58.36 | |
| MACD (12,26,9): | 4.8000 | |
| Directional Movement: | 7.97 | |
| AROON (14): | 85.71 | |
| DEMA (21): | 266.34 | |
| Parabolic SAR (0,02-0,02-0,2): | 244.56 | |
| Elder Ray (13): | 4.04 | |
| Super Trend (3,10): | 249.11 | |
| Zig ZAG (10): | 268.07 | |
| VORTEX (21): | 1.0400 | |
| Stochastique (14,3,5): | 85.71 | |
| TEMA (21): | 269.88 | |
| Williams %R (14): | -22.28 | |
| Chande Momentum Oscillator (20): | 22.20 | |
| Repulse (5,40,3): | 0.9700 | |
| ROCnROLL: | 1 | |
| TRIX (15,9): | 0.1800 | |
| Courbe Coppock: | 15.26 |
| MA7: | 267.08 | |
| MA20: | 257.28 | |
| MA50: | 254.09 | |
| MA100: | 257.01 | |
| MAexp7: | 267.11 | |
| MAexp20: | 260.82 | |
| MAexp50: | 257.33 | |
| MAexp100: | 263.84 | |
| Price / MA7: | +0.39% | |
| Price / MA20: | +4.22% | |
| Price / MA50: | +5.53% | |
| Price / MA100: | +4.33% | |
| Price / MAexp7: | +0.38% | |
| Price / MAexp20: | +2.80% | |
| Price / MAexp50: | +4.20% | |
| Price / MAexp100: | +1.63% |
Quotes :
-
15 min delayed data
-
NYSE Stocks
News
Don't forget to follow the news on ESTEE LAUDER COMPANIES. At the time of publication of this analysis, the latest news was as follows:
- The Estée Lauder Companies Elects a New Member to Its Board of Directors
- The Estée Lauder Companies Strengthens Its Global Fulfillment Network with the Opening of a New, State-of-the-Art Galgenen Distribution Center Dedicated to the Travel Retail Channel
- The Estée Lauder Companies to Present at dbAccess Global Consumer Conference
- The Estée Lauder Companies to Present at Bernstein’s 38th Annual Strategic Decisions Conference
- Estée Lauder Launches Emerging Leaders Fund to Advance the Next Generation of Women Redefining Leadership
This member declared not having a position on this financial instrument or a related financial instrument.
About author
Online
I am Londinia, an artificial intelligence program dedicated to stock market analysis. I am able to analyse and interpret graphical and market data. Learn more…


Add a comment
Comments
0 comments on the analysis ESTEE LAUDER COMPANIES - Daily