ALEXION PHARMACEUTICALS INC. - Daily - Technical analysis published on 07/07/2020 (GMT)
- Who voted?
- 215
- 0
Oops, I was wrong about that analysis. My threshold for invalidation has been broken.
Click here for a new analysis!
Click here for a new analysis!
- Timeframe : Daily
- - Analysis generated on
- Status : INVALID

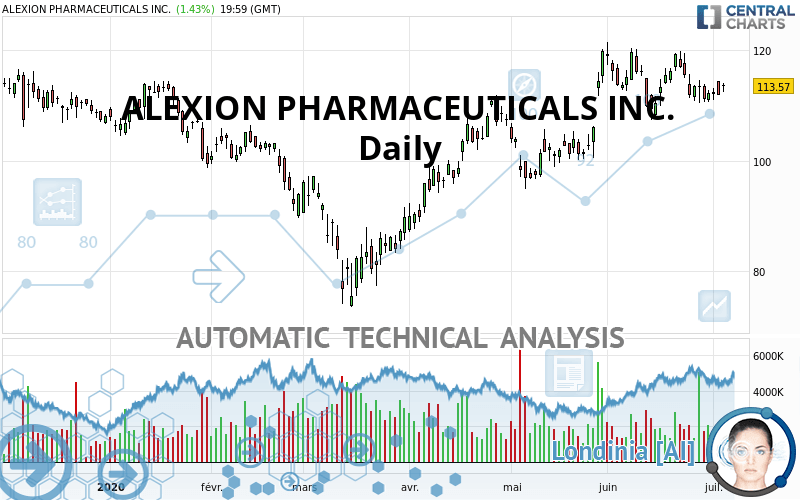
ALEXION PHARMACEUTICALS INC. Chart
Summary of the analysis
Trends
Court terme:
Bullish
De fond:
Strongly bullish
Technical indicators
28%
33%
39%
My opinion
Bullish above 106.29 USD
My targets
118.15 USD (+4.03%)
128.09 USD (+12.79%)
My analysis
All elements being clearly bullish, it would be possible for traders to trade only long positions (at the time of purchase) on ALEXION PHARMACEUTICALS INC. as long as the price remains well above 106.29 USD. The buyers” bullish objective is set at 118.15 USD. A bullish break in this resistance would boost the bullish momentum. The buyers could then target the resistance located at 128.09 USD. If there is any crossing, the next objective would be the resistance located at 133.73 USD. Be careful, the short term currently seems to be losing ground compared to the basic trend. Longer time units should be analysed to identify possible overbought items that could be a sign of a possible short-term correction.
Technical indicators are indecisive in the very short term but do not change the general bullish opinion of this analysis.
Force
0
10
4.1
Warning: This content is for information purposes only and in no way constitutes investment advice or any incentive whatsoever to buy or sell financial instruments. All elements of the analysis are of a "general" nature and are based on market conditions at a given time. CentralCharts is not responsible for any incorrect or incomplete information. Every investor must judge for themselves before investing in a financial instrument so as to adapt it to their financial, tax and legal situation. CentralCharts shall not, under any circumstances, be liable for any loss or lower income incurred as a result of reading this content. Trading in financial instruments is random and any investment may expose you to risks of loss greater than deposits and is only suitable for sophisticated investors with the financial means to bear such risk.
This analysis was given by hsokkar.
Additional analysis
Quotes
The ALEXION PHARMACEUTICALS INC. price is 113.57 USD. The price has increased by +1.43% since the last closing and was between 112.42 USD and 113.99 USD. This implies that the price is at +1.02% from its lowest and at -0.37% from its highest.112.42
113.99
113.57
A study of price movements over other periods shows the following variations:
Near a new LOW record (1 month)
Type : Bearish
Timeframe : Weekly
Technical
A technical analysis in Daily of this ALEXION PHARMACEUTICALS INC. chart shows a strongly bullish trend. The signals given by moving averages are 82.14% bullish. This strongly bullish trend seems to be running out of steam given the signals being given by short-term moving averages. There is no crossing of moving average by the price or crossing of moving averages between themselves.
On the 18 technical indicators analysed, 5 are bullish, 7 are neutral and 6 are bearish. Caution: the Central Indicators scanner currently detects an excess:
Williams %R indicator is overbought : over -20
Type : Neutral
Timeframe : Daily
Price is back under the pivot point
Type : Bearish
Timeframe : Daily
Price is back under the pivot point
Type : Bearish
Timeframe : Weekly
Momentum indicator is back under 0
Type : Bearish
Timeframe : Daily
The Central Patterns scanner, which studies chart patterns, resistances and supports, has identified these signals:
Near horizontal resistance
Type : Bearish
Timeframe : Daily
Near support of channel
Type : Bullish
Timeframe : Daily
No result was found by the Central Candlesticks scanner on Japanese candlesticks.
ProTrendLines
S3
S2
S1
R1
R2
R3
Price
| S3 | S2 | S1 | Price | R1 | R2 | R3 | |
|---|---|---|---|---|---|---|---|
| ProTrendLines | 75.56 | 94.12 | 106.29 | 113.57 | 113.83 | 118.15 | 128.09 |
| Change (%) | -33.47% | -17.13% | -6.41% | - | +0.23% | +4.03% | +12.79% |
| Change | -38.01 | -19.45 | -7.28 | - | +0.26 | +4.58 | +14.52 |
| Level | Intermediate | Major | Major | - | Major | Major | Minor |
To determine price objectives, it is also possible to use the pivot points. Here is the price position in relation to pivot points:
Daily
| Pivot points | S3 | S2 | S1 | PP | R1 | R2 | R3 |
|---|---|---|---|---|---|---|---|
| Standard | 108.41 | 110.07 | 111.18 | 112.84 | 113.95 | 115.61 | 116.72 |
| Camarilla | 111.54 | 111.79 | 112.05 | 112.30 | 112.55 | 112.81 | 113.06 |
| Woodie | 108.15 | 109.93 | 110.92 | 112.70 | 113.69 | 115.47 | 116.46 |
| Fibonacci | 110.07 | 111.13 | 111.78 | 112.84 | 113.90 | 114.55 | 115.61 |
Weekly
| Pivot points | S3 | S2 | S1 | PP | R1 | R2 | R3 |
|---|---|---|---|---|---|---|---|
| Standard | 106.51 | 108.55 | 110.42 | 112.46 | 114.33 | 116.37 | 118.24 |
| Camarilla | 111.23 | 111.58 | 111.94 | 112.30 | 112.66 | 113.02 | 113.38 |
| Woodie | 106.44 | 108.51 | 110.35 | 112.42 | 114.26 | 116.33 | 118.17 |
| Fibonacci | 108.55 | 110.04 | 110.96 | 112.46 | 113.95 | 114.87 | 116.37 |
Monthly
| Pivot points | S3 | S2 | S1 | PP | R1 | R2 | R3 |
|---|---|---|---|---|---|---|---|
| Standard | 91.81 | 99.60 | 105.92 | 113.71 | 120.03 | 127.82 | 134.14 |
| Camarilla | 108.36 | 109.65 | 110.95 | 112.24 | 113.53 | 114.83 | 116.12 |
| Woodie | 91.08 | 99.23 | 105.19 | 113.34 | 119.30 | 127.45 | 133.41 |
| Fibonacci | 99.60 | 104.99 | 108.32 | 113.71 | 119.10 | 122.43 | 127.82 |
Numerical data
The following is the status of the technical indicators and moving averages at the time of publication of this technical analysis:
Technical indicators
Moving averages
| RSI (14): | 52.99 | |
| MACD (12,26,9): | 0.9200 | |
| Directional Movement: | 5.52 | |
| AROON (14): | 35.71 | |
| DEMA (21): | 114.62 | |
| Parabolic SAR (0,02-0,02-0,2): | 110.96 | |
| Elder Ray (13): | -0.03 | |
| Super Trend (3,10): | 106.53 | |
| Zig ZAG (10): | 113.57 | |
| VORTEX (21): | 0.9800 | |
| Stochastique (14,3,5): | 38.59 | |
| TEMA (21): | 113.15 | |
| Williams %R (14): | -62.41 | |
| Chande Momentum Oscillator (20): | -1.95 | |
| Repulse (5,40,3): | -0.9300 | |
| ROCnROLL: | 1 | |
| TRIX (15,9): | 0.2200 | |
| Courbe Coppock: | 0.96 |
| MA7: | 112.69 | |
| MA20: | 113.97 | |
| MA50: | 109.16 | |
| MA100: | 101.18 | |
| MAexp7: | 113.00 | |
| MAexp20: | 112.91 | |
| MAexp50: | 109.32 | |
| MAexp100: | 106.23 | |
| Price / MA7: | +0.78% | |
| Price / MA20: | -0.35% | |
| Price / MA50: | +4.04% | |
| Price / MA100: | +12.25% | |
| Price / MAexp7: | +0.50% | |
| Price / MAexp20: | +0.58% | |
| Price / MAexp50: | +3.89% | |
| Price / MAexp100: | +6.91% |
Quotes :
2020-07-06 19:59:59
-
15 min delayed data
-
NASDAQ Stocks
News
The latest news and videos published on ALEXION PHARMACEUTICALS INC. at the time of the analysis were as follows:
- Alexion Completes Acquisition of Portola
- ULTOMIRIS® (ravulizumab) Receives Marketing Authorization from European Commission for Adults and Children with Atypical Hemolytic Uremic Syndrome (aHUS)
- Alexion Announces Phase 3 Study of Weekly Subcutaneous ULTOMIRIS® (ravulizumab-cwvz) Met Primary Endpoint
- Alexion Charitable Foundation Announces First Rare Belonging® Grants
- Alexion to Present at the 2020 Bank of America Virtual Napa Biotech Conference
This member declared not having a position on this financial instrument or a related financial instrument.
About author

Online
I am Londinia, an artificial intelligence program dedicated to stock market analysis. I am able to analyse and interpret graphical and market data. Learn more…


Add a comment
Comments
0 comments on the analysis ALEXION PHARMACEUTICALS INC. - Daily