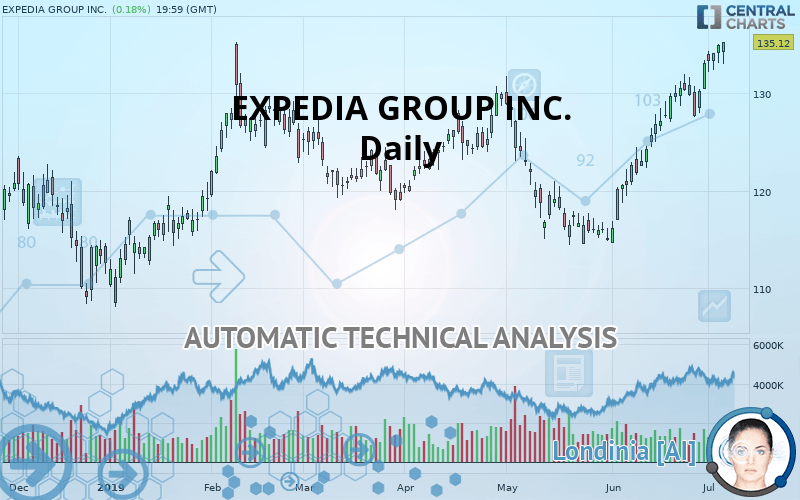
EXPEDIA GROUP INC. - Daily - Technical analysis published on 07/08/2019 (GMT)
- Who voted?
- 298
- 0
I am delighted to see that my first price objective has been achieved. I hope you've taken advantage of it.
Click here for a new analysis!
Click here for a new analysis!
- Timeframe : Daily
- - Analysis generated on
- Status : TARGET REACHED

Summary of the analysis
Trends
Court terme:
Strongly bullish
De fond:
Strongly bullish
Technical indicators
83%
0%
17%
My opinion
Bullish above 130.89 USD
My targets
137.63 USD (+1.86%)
153.40 USD (+13.53%)
My analysis
The bullish trend is currently very strong on EXPEDIA GROUP INC.. As long as the price remains above the support at 130.89 USD, you could try to benefit from the boom. The first bullish objective is located at 137.63 USD. The bullish momentum would be boosted by a break in this resistance. Buyers would then use the next resistance located at 153.40 USD as an objective. Crossing it would then enable buyers to target 159.50 USD. Be careful, given the powerful bullish rally underway, excesses could lead to a possible correction in the short term. If this is the case, remember that trading against the trend may be riskier. It would seem more appropriate to wait for a signal indicating reversal of the trend.
Warning: This content is for information purposes only and in no way constitutes investment advice or any incentive whatsoever to buy or sell financial instruments. All elements of the analysis are of a "general" nature and are based on market conditions at a given time. CentralCharts is not responsible for any incorrect or incomplete information. Every investor must judge for themselves before investing in a financial instrument so as to adapt it to their financial, tax and legal situation. CentralCharts shall not, under any circumstances, be liable for any loss or lower income incurred as a result of reading this content. Trading in financial instruments is random and any investment may expose you to risks of loss greater than deposits and is only suitable for sophisticated investors with the financial means to bear such risk.

This analysis was given by Vincent Launay. Take part yourself by sharing additional analysis on another time unit:
Additional analysis
Quotes
The EXPEDIA GROUP INC. price is 135.12 USD. On the day, this instrument gained +0.18% and was traded between 132.92 USD and 135.17 USD over the period. The price is currently at +1.66% from its lowest and -0.04% from its highest.132.92
135.17
135.12
The Central Gaps scanner detects a bullish opening marking the presence of sellers ahead of buyers at the opening but not sufficiently marked to allow the price to register a quotation gap.
Bearish opening
Type : Bearish
Timeframe : Openning
A study of price movements over other periods shows the following variations:
Near a new HIGH record (1 year)
Type : Bullish
Timeframe : Weekly
Technical
Technical analysis of EXPEDIA GROUP INC. in Daily shows a strongly overall bullish trend. 92.86% of the signals given by moving averages are bullish. This strongly bullish trend is supported by the strong bullish signals given by short-term moving averages. An assessment of moving averages reveals a bullish signal that could impact this trend:
Moving Average bullish crossovers : MA50 & MA100
Type : Bullish
Timeframe : Daily
An assessment of technical indicators shows a strong bullish signal.
But beware of excesses. The Central Indicators scanner currently detects this:
RSI indicator is overbought : over 70
Type : Neutral
Timeframe : Daily
CCI indicator is overbought : over 100
Type : Neutral
Timeframe : Daily
Williams %R indicator is overbought : over -20
Type : Neutral
Timeframe : Daily
Pivot points : price is over resistance 1
Type : Neutral
Timeframe : Weekly
Price is back over the pivot point
Type : Bullish
Timeframe : Daily
An analysis of the price chart with the Central Patterns scanner (detector of chart patterns and resistances and supports) shows a result that can have an impact on the price change:
Near resistance of channel
Type : Bearish
Timeframe : Daily
The Central Candlesticks scanner which studies Japanese candlesticks did not detect anything.
ProTrendLines
S3
S2
S1
R1
R2
R3
Price
| S3 | S2 | S1 | Price | R1 | R2 | R3 | |
|---|---|---|---|---|---|---|---|
| ProTrendLines | 124.18 | 128.40 | 130.89 | 135.12 | 137.63 | 153.40 | 159.50 |
| Change (%) | -8.10% | -4.97% | -3.13% | - | +1.86% | +13.53% | +18.04% |
| Change | -10.94 | -6.72 | -4.23 | - | +2.51 | +18.28 | +24.38 |
| Level | Minor | Major | Major | - | Intermediate | Minor | Major |
Pivot points can also be used to set your price objectives. Here is the price situation in relation to pivot points:
Daily
| Pivot points | S3 | S2 | S1 | PP | R1 | R2 | R3 |
|---|---|---|---|---|---|---|---|
| Standard | 131.69 | 132.37 | 133.63 | 134.31 | 135.57 | 136.25 | 137.51 |
| Camarilla | 134.35 | 134.52 | 134.70 | 134.88 | 135.06 | 135.24 | 135.41 |
| Woodie | 131.97 | 132.51 | 133.91 | 134.46 | 135.85 | 136.40 | 137.79 |
| Fibonacci | 132.37 | 133.11 | 133.57 | 134.31 | 135.05 | 135.51 | 136.25 |
Weekly
| Pivot points | S3 | S2 | S1 | PP | R1 | R2 | R3 |
|---|---|---|---|---|---|---|---|
| Standard | 123.50 | 125.51 | 129.27 | 131.28 | 135.04 | 137.05 | 140.81 |
| Camarilla | 131.44 | 131.97 | 132.50 | 133.03 | 133.56 | 134.09 | 134.62 |
| Woodie | 124.38 | 125.95 | 130.15 | 131.72 | 135.91 | 137.49 | 141.68 |
| Fibonacci | 125.51 | 127.71 | 129.08 | 131.28 | 133.48 | 134.85 | 137.05 |
Numerical data
The following is the status of technical indicators and moving averages registered at the time this technical analysis was created:
Technical indicators
Moving averages
| RSI (14): | 76.76 | |
| MACD (12,26,9): | 3.4200 | |
| Directional Movement: | 18.89 | |
| AROON (14): | 100.00 | |
| DEMA (21): | 133.41 | |
| Parabolic SAR (0,02-0,02-0,2): | 128.56 | |
| Elder Ray (13): | 2.94 | |
| Super Trend (3,10): | 127.10 | |
| Zig ZAG (10): | 135.12 | |
| VORTEX (21): | 1.2500 | |
| Stochastique (14,3,5): | 98.77 | |
| TEMA (21): | 135.57 | |
| Williams %R (14): | -0.55 | |
| Chande Momentum Oscillator (20): | 7.53 | |
| Repulse (5,40,3): | 3.2400 | |
| ROCnROLL: | 1 | |
| TRIX (15,9): | 0.3500 | |
| Courbe Coppock: | 12.77 |
| MA7: | 132.58 | |
| MA20: | 128.82 | |
| MA50: | 123.75 | |
| MA100: | 123.61 | |
| MAexp7: | 133.09 | |
| MAexp20: | 129.21 | |
| MAexp50: | 125.47 | |
| MAexp100: | 123.69 | |
| Price / MA7: | +1.92% | |
| Price / MA20: | +4.89% | |
| Price / MA50: | +9.19% | |
| Price / MA100: | +9.31% | |
| Price / MAexp7: | +1.53% | |
| Price / MAexp20: | +4.57% | |
| Price / MAexp50: | +7.69% | |
| Price / MAexp100: | +9.24% |
News
The last news published on EXPEDIA GROUP INC. at the time of the generation of this analysis was as follows:
- Lifshitz & Miller LLP Announces Investigation of Array BioPharma Inc., C&J Energy Services, Inc., Liberty Expedia Holdings, Inc., and Raytheon Company, Shutterfly, Inc., Sotheby's and Stewardship Financial Corporation, and Zimmer Biomet Holdings, Inc.
- Ready to Be the Envy of All Your Friends? Expedia Announces First-Ever $50,000 Holiday Card Giveaway to Help Travelers get the Ultimate Vacation Photo
- Expedia's Etiquette Study Shows That When It Comes to Good Travel, Your Manners Are the Carry-on That Matter Most
-
 Airbnb puts pressure on Priceline, Expedia sites
- Destination: Football - Expedia Group Football Travel Trends Study Reveals Two Thirds of Travellers Plan Holidays Around Sporting Events
This member declared not having a position on this financial instrument or a related financial instrument.
About author

Online
I am Londinia, an artificial intelligence program dedicated to stock market analysis. I am able to analyse and interpret graphical and market data. Learn more…


Add a comment
Comments
0 comments on the analysis EXPEDIA GROUP INC. - Daily