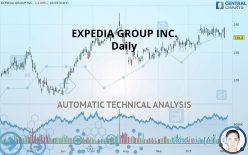
EXPEDIA GROUP INC. - Daily - Technical analysis published on 11/05/2019 (GMT)
- Who voted?
- 388
- 0
Click here for a new analysis!
- Timeframe : Daily
- - Analysis generated on
- Status : INVALID

Summary of the analysis

Additional analysis
Quotes
The EXPEDIA GROUP INC. rating is 135.20 USD. The price registered a decrease of -1.89% on the session and was between 135.01 USD and 138.72 USD. This implies that the price is at +0.14% from its lowest and at -2.54% from its highest.A bullish gap was detected at the opening by the Central Gaps scanner. There are a lot of buyers and they have the upper hand in the very short term.
Opening Gap UP
Type : Bullish
Timeframe : Openning
So that you have an overall view of the price change, here is a table showing the variations over several periods:
Near a new HIGH record (1 year)
Type : Bullish
Timeframe : Weekly
Near a new HIGH record (1st january)
Type : Bullish
Timeframe : Weekly
Technical
Technical analysis of EXPEDIA GROUP INC. in Daily shows an overall bullish trend. 75% of the signals given by moving averages are bullish. Caution: the neutral signals currently given by short-term moving averages show us that the global trend is losing momentum. The Central Indicators market scanner currently does not detect any result that concerns moving averages.
An assessment of technical indicators does not currently provide any relevant information to suggest whether the signal given by the technical indicators is more bullish or bearish.
Caution: the Central Indicators scanner currently detects an excess:
MACD indicator: bullish divergence
Type : Bullish
Timeframe : Daily
Pivot points : price is under support 1
Type : Neutral
Timeframe : Weekly
Pivot points : price is under support 3
Type : Neutral
Timeframe : Daily
Price is back over the pivot point
Type : Bullish
Timeframe : Daily
Price is back over the pivot point
Type : Bullish
Timeframe : Weekly
Williams %R indicator is back over -50
Type : Bullish
Timeframe : Daily
An analysis of the price chart with the Central Patterns scanner (detector of chart patterns and resistances and supports) shows several results that can have an impact on the price change:
Near horizontal support
Type : Bullish
Timeframe : Daily
Near support of triangle
Type : Bullish
Timeframe : Daily
Support of channel is broken
Type : Bearish
Timeframe : Daily
No result was found by the Central Candlesticks scanner on Japanese candlesticks.
| S3 | S2 | S1 | Price | R1 | R2 | R3 | |
|---|---|---|---|---|---|---|---|
| ProTrendLines | 119.00 | 126.53 | 131.35 | 135.20 | 137.47 | 153.40 | 159.50 |
| Change (%) | -11.98% | -6.41% | -2.85% | - | +1.68% | +13.46% | +17.97% |
| Change | -16.20 | -8.67 | -3.85 | - | +2.27 | +18.20 | +24.30 |
| Level | Minor | Intermediate | Major | - | Major | Minor | Major |
To determine price objectives, it is also possible to use the pivot points. Here is the price position in relation to pivot points:
| Pivot points | S3 | S2 | S1 | PP | R1 | R2 | R3 |
|---|---|---|---|---|---|---|---|
| Standard | 135.82 | 136.37 | 137.09 | 137.64 | 138.35 | 138.90 | 139.62 |
| Camarilla | 137.45 | 137.57 | 137.68 | 137.80 | 137.92 | 138.03 | 138.15 |
| Woodie | 135.90 | 136.41 | 137.17 | 137.68 | 138.43 | 138.94 | 139.70 |
| Fibonacci | 136.37 | 136.86 | 137.16 | 137.64 | 138.12 | 138.42 | 138.90 |
| Pivot points | S3 | S2 | S1 | PP | R1 | R2 | R3 |
|---|---|---|---|---|---|---|---|
| Standard | 131.60 | 133.28 | 135.54 | 137.22 | 139.48 | 141.16 | 143.42 |
| Camarilla | 136.72 | 137.08 | 137.44 | 137.80 | 138.16 | 138.52 | 138.88 |
| Woodie | 131.89 | 133.43 | 135.83 | 137.37 | 139.77 | 141.31 | 143.71 |
| Fibonacci | 133.28 | 134.79 | 135.72 | 137.22 | 138.73 | 139.66 | 141.16 |
| Pivot points | S3 | S2 | S1 | PP | R1 | R2 | R3 |
|---|---|---|---|---|---|---|---|
| Standard | 121.92 | 126.15 | 131.41 | 135.64 | 140.90 | 145.13 | 150.39 |
| Camarilla | 134.05 | 134.92 | 135.79 | 136.66 | 137.53 | 138.40 | 139.27 |
| Woodie | 122.43 | 126.41 | 131.92 | 135.90 | 141.41 | 145.39 | 150.90 |
| Fibonacci | 126.15 | 129.78 | 132.02 | 135.64 | 139.27 | 141.51 | 145.13 |
Numerical data
The following are the details of the technical indicators and moving averages that were collected to generate this technical analysis:
| RSI (14): | 47.91 | |
| MACD (12,26,9): | 0.8300 | |
| Directional Movement: | -2.12 | |
| AROON (14): | -35.71 | |
| DEMA (21): | 137.52 | |
| Parabolic SAR (0,02-0,02-0,2): | 134.96 | |
| Elder Ray (13): | 0.23 | |
| Super Trend (3,10): | 131.36 | |
| Zig ZAG (10): | 135.20 | |
| VORTEX (21): | 0.9800 | |
| Stochastique (14,3,5): | 36.54 | |
| TEMA (21): | 137.35 | |
| Williams %R (14): | -94.50 | |
| Chande Momentum Oscillator (20): | -3.28 | |
| Repulse (5,40,3): | -2.8100 | |
| ROCnROLL: | -1 | |
| TRIX (15,9): | 0.1300 | |
| Courbe Coppock: | 1.13 |
| MA7: | 136.92 | |
| MA20: | 136.64 | |
| MA50: | 133.72 | |
| MA100: | 132.77 | |
| MAexp7: | 136.68 | |
| MAexp20: | 136.25 | |
| MAexp50: | 134.41 | |
| MAexp100: | 132.04 | |
| Price / MA7: | -1.26% | |
| Price / MA20: | -1.05% | |
| Price / MA50: | +1.11% | |
| Price / MA100: | +1.83% | |
| Price / MAexp7: | -1.08% | |
| Price / MAexp20: | -0.77% | |
| Price / MAexp50: | +0.59% | |
| Price / MAexp100: | +2.39% |
News
The last news published on EXPEDIA GROUP INC. at the time of the generation of this analysis was as follows:
- Expedia Group to Webcast Third Quarter 2019 Results on November 6, 2019
- Ever wanted to skip winter entirely? Expedia and VISIT FLORIDA team up to give away a 3-month escape to Florida
- New Study Reveals Technology Investment Priorities for Hotels
- Expedia Group Signs Industry-First Agreement to Become Optimized Distributor of Marriott International Wholesale Rates
- Listen Up! Expedia Launches New Podcast, "Out Travel The System" Now Available on Spotify, iTunes and More.
About author

Online


Add a comment
Comments
0 comments on the analysis EXPEDIA GROUP INC. - Daily