EXTRA SPACE STORAGE INC - Daily - Technical analysis published on 10/28/2019 (GMT)
- 250
- 0
Click here for a new analysis!
- Timeframe : Daily
- - Analysis generated on
- Status : TARGET REACHED
Summary of the analysis

Additional analysis
Quotes
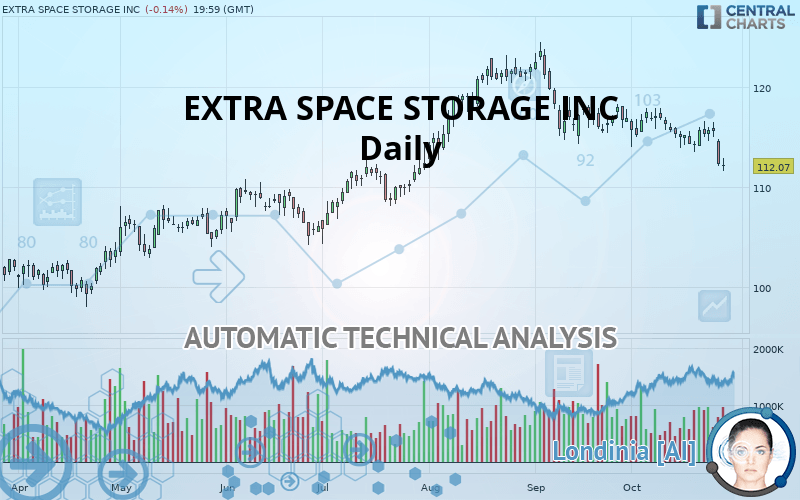
The EXTRA SPACE STORAGE INC price is 112.07 USD. On the day, this instrument lost -0.14% with the lowest point at 111.59 USD and the highest point at 112.82 USD. The deviation from the price is +0.43% for the low point and -0.66% for the high point.Here is a more detailed summary of the historical variations registered by EXTRA SPACE STORAGE INC:
Near a new HIGH record (1 month)
Type : Bullish
Timeframe : Weekly
Technical
Technical analysis of EXTRA SPACE STORAGE INC in Daily shows an overall bearish trend. 67.86% of the signals given by moving averages are bearish. The overall trend is reinforced by the strong bearish signals from short-term moving averages. The Central Indicators scanner detects bearish signals on moving averages that could impact this trend:
Bearish trend reversal : adaptative moving average 100
Type : Bearish
Timeframe : Daily
Bearish price crossover with Moving Average 100
Type : Bearish
Timeframe : Daily
In fact, 12 technical indicators on 18 studied are currently bearish. Caution: the Central Indicators scanner currently detects an excess:
CCI indicator is oversold : under -100
Type : Neutral
Timeframe : Daily
MACD indicator: bearish divergence
Type : Bearish
Timeframe : Daily
Williams %R indicator is oversold : under -80
Type : Neutral
Timeframe : Daily
MACD crosses DOWN its Moving Average
Type : Bearish
Timeframe : Daily
Ichimoku : price is under the cloud
Type : Bearish
Timeframe : Daily
Price is back under the pivot point
Type : Bearish
Timeframe : Daily
Price is back under the pivot point
Type : Bearish
Timeframe : Weekly
The Central Patterns scanner, which studies chart patterns, resistances and supports, has identified this signal:
Support of channel is broken
Type : Bearish
Timeframe : Daily
For a small setback in the very short term, the Central Candlesticks scanner currently notes the presence of this bearish pattern in Japanese candlesticks:
Downside gap
Type : Bearish
Timeframe : Daily
| S3 | S2 | S1 | Price | R1 | R2 | R3 | |
|---|---|---|---|---|---|---|---|
| ProTrendLines | 94.31 | 100.96 | 104.91 | 112.07 | 114.24 | 117.95 | 123.52 |
| Change (%) | -15.85% | -9.91% | -6.39% | - | +1.94% | +5.25% | +10.22% |
| Change | -17.76 | -11.11 | -7.16 | - | +2.17 | +5.88 | +11.45 |
| Level | Major | Major | Intermediate | - | Intermediate | Major | Major |
Attention could also be paid to pivot points to set price objectives:
| Pivot points | S3 | S2 | S1 | PP | R1 | R2 | R3 |
|---|---|---|---|---|---|---|---|
| Standard | 108.50 | 110.26 | 111.25 | 113.01 | 114.00 | 115.76 | 116.75 |
| Camarilla | 111.47 | 111.73 | 111.98 | 112.23 | 112.48 | 112.73 | 112.99 |
| Woodie | 108.11 | 110.07 | 110.86 | 112.82 | 113.61 | 115.57 | 116.36 |
| Fibonacci | 110.26 | 111.31 | 111.96 | 113.01 | 114.06 | 114.71 | 115.76 |
| Pivot points | S3 | S2 | S1 | PP | R1 | R2 | R3 |
|---|---|---|---|---|---|---|---|
| Standard | 106.18 | 109.10 | 110.67 | 113.59 | 115.16 | 118.08 | 119.65 |
| Camarilla | 111.00 | 111.41 | 111.82 | 112.23 | 112.64 | 113.05 | 113.47 |
| Woodie | 105.50 | 108.76 | 109.99 | 113.25 | 114.48 | 117.74 | 118.97 |
| Fibonacci | 109.10 | 110.82 | 111.88 | 113.59 | 115.31 | 116.37 | 118.08 |
| Pivot points | S3 | S2 | S1 | PP | R1 | R2 | R3 |
|---|---|---|---|---|---|---|---|
| Standard | 102.80 | 108.27 | 112.55 | 118.02 | 122.30 | 127.77 | 132.05 |
| Camarilla | 114.14 | 115.03 | 115.93 | 116.82 | 117.71 | 118.61 | 119.50 |
| Woodie | 102.20 | 107.97 | 111.95 | 117.72 | 121.70 | 127.47 | 131.44 |
| Fibonacci | 108.27 | 112.00 | 114.30 | 118.02 | 121.75 | 124.05 | 127.77 |
Numerical data
The following is the status of the technical indicators and moving averages at the time of publication of this technical analysis:
| RSI (14): | 32.37 | |
| MACD (12,26,9): | -0.8700 | |
| Directional Movement: | -17.45 | |
| AROON (14): | -92.86 | |
| DEMA (21): | 114.12 | |
| Parabolic SAR (0,02-0,02-0,2): | 116.50 | |
| Elder Ray (13): | -2.44 | |
| Super Trend (3,10): | 117.15 | |
| Zig ZAG (10): | 112.07 | |
| VORTEX (21): | 0.8500 | |
| Stochastique (14,3,5): | 19.86 | |
| TEMA (21): | 113.41 | |
| Williams %R (14): | -92.28 | |
| Chande Momentum Oscillator (20): | -4.21 | |
| Repulse (5,40,3): | -1.9900 | |
| ROCnROLL: | 2 | |
| TRIX (15,9): | -0.0800 | |
| Courbe Coppock: | 4.10 |
| MA7: | 114.38 | |
| MA20: | 115.39 | |
| MA50: | 117.19 | |
| MA100: | 113.71 | |
| MAexp7: | 113.96 | |
| MAexp20: | 115.14 | |
| MAexp50: | 115.45 | |
| MAexp100: | 113.02 | |
| Price / MA7: | -2.02% | |
| Price / MA20: | -2.88% | |
| Price / MA50: | -4.37% | |
| Price / MA100: | -1.44% | |
| Price / MAexp7: | -1.66% | |
| Price / MAexp20: | -2.67% | |
| Price / MAexp50: | -2.93% | |
| Price / MAexp100: | -0.84% |
News
Don"t forget to follow the news on EXTRA SPACE STORAGE INC. At the time of publication of this analysis, the latest news was as follows:
- Extra Space Storage Inc. Announces Date of Earnings Release and Conference Call to Discuss 3rd Quarter 2019 Results
- Extra Space Storage Inc. to Present at Bank of America Merrill Lynch 2019 Global Real Estate Conference
- Extra Space Storage Inc. Announces 3rd Quarter 2019 Dividend
- Extra Space Storage Inc. Reports 2019 Second Quarter Results
- Extra Space Storage Inc. Assigned BBB Issuer Credit Rating by S&P Global Ratings
About author

Online


Add a comment
Comments
0 comments on the analysis EXTRA SPACE STORAGE INC - Daily