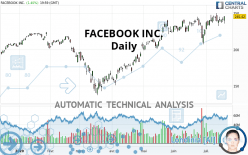
META PLATFORMS INC. - Daily - Technical analysis published on 07/21/2020 (GMT)
- Who voted?
- 224
- 0
I am delighted to see that my first price objective has been achieved. I hope you've taken advantage of it.
Click here for a new analysis!
Click here for a new analysis!
- Timeframe : Daily
- - Analysis generated on
- Status : TARGET REACHED

Summary of the analysis
Trends
Court terme:
Strongly bullish
De fond:
Strongly bullish
Technical indicators
67%
0%
33%
My opinion
Bullish above 223.23 USD
My targets
264.53 USD (+7.79%)
283.88 USD (+15.67%)
My analysis
FACEBOOK INC. is part of a very strong bullish trend. Traders may consider trading only long positions (at the time of purchase) as long as the price remains well above 223.23 USD. The next resistance located at 264.53 USD is the next bullish objective to be reached. A bullish break in this resistance would boost the bullish momentum. The bullish movement could then continue towards the next resistance located at 283.88 USD. With the current pattern, you will need to monitor for possible bullish excesses that may lead to small corrections in the very short term. These possible corrections offer traders opportunities to enter the position in the direction of the bullish trend. Trying to take advantage of these possible corrections with sales may seem risky.
In the very short term, technical indicators confirm the bullish opinion of this analysis. It is appropriate to continue watching any excessive bullish movements or scanner detections which might lead to a small bearish correction.
Force
0
10
8.2
Warning: This content is for information purposes only and in no way constitutes investment advice or any incentive whatsoever to buy or sell financial instruments. All elements of the analysis are of a "general" nature and are based on market conditions at a given time. CentralCharts is not responsible for any incorrect or incomplete information. Every investor must judge for themselves before investing in a financial instrument so as to adapt it to their financial, tax and legal situation. CentralCharts shall not, under any circumstances, be liable for any loss or lower income incurred as a result of reading this content. Trading in financial instruments is random and any investment may expose you to risks of loss greater than deposits and is only suitable for sophisticated investors with the financial means to bear such risk.

This analysis was given by ALBAYANTRADERS. Take part yourself by sharing additional analysis on another time unit:
Additional analysis
Quotes
The FACEBOOK INC. rating is 245.42 USD. The price has increased by +1.40% since the last closing and was traded between 235.63 USD and 246.05 USD over the period. The price is currently at +4.15% from its lowest and -0.26% from its highest.235.63
246.05
245.42
A bearish opening was detected by the Central Gaps scanner. Sellers are trying to impose a bearish trend in the very short term.
Bearish opening
Type : Bearish
Timeframe : Openning
A study of price movements over other periods shows the following variations:
Near a new HIGH record (5 years)
Type : Bullish
Timeframe : Weekly
Near a new HIGH record (1 year)
Type : Bullish
Timeframe : Weekly
Near a new HIGH record (1st january)
Type : Bullish
Timeframe : Weekly
Near a new HIGH record (1 month)
Type : Bullish
Timeframe : Weekly
Technical
A technical analysis in Daily of this FACEBOOK INC. chart shows a strongly bullish trend. 92.86% of the signals given by moving averages are bullish. The overall trend is supported by the strong bullish signals from short-term moving averages. The Central Indicators market scanner currently does not detect any result that concerns moving averages.
The probability of a further increase are moderate given the direction of the technical indicators.
But beware of excesses. The Central Indicators scanner currently detects this:
Williams %R indicator is overbought : over -20
Type : Neutral
Timeframe : Daily
Pivot points : price is over resistance 1
Type : Neutral
Timeframe : Daily
An analysis of the price chart with the Central Patterns scanner (detector of chart patterns and resistances and supports) shows several results that can have an impact on the price change:
Near resistance of channel
Type : Bearish
Timeframe : Daily
Horizontal resistance is broken
Type : Bullish
Timeframe : Daily
The Central Candlesticks scanner which studies Japanese candlesticks did not detect anything.
ProTrendLines
S3
S2
S1
Price
| S3 | S2 | S1 | Price | |
|---|---|---|---|---|
| ProTrendLines | 193.29 | 201.99 | 223.23 | 245.42 |
| Change (%) | -21.24% | -17.70% | -9.04% | - |
| Change | -52.13 | -43.43 | -22.19 | - |
| Level | Minor | Minor | Major | - |
To determine price objectives, it is also possible to use the pivot points. Here is the price position in relation to pivot points:
Daily
| Pivot points | S3 | S2 | S1 | PP | R1 | R2 | R3 |
|---|---|---|---|---|---|---|---|
| Standard | 232.24 | 235.05 | 238.54 | 241.35 | 244.84 | 247.65 | 251.14 |
| Camarilla | 240.30 | 240.88 | 241.45 | 242.03 | 242.61 | 243.19 | 243.76 |
| Woodie | 232.58 | 235.22 | 238.88 | 241.52 | 245.18 | 247.82 | 251.48 |
| Fibonacci | 235.05 | 237.46 | 238.94 | 241.35 | 243.76 | 245.24 | 247.65 |
Weekly
| Pivot points | S3 | S2 | S1 | PP | R1 | R2 | R3 |
|---|---|---|---|---|---|---|---|
| Standard | 214.54 | 223.28 | 232.66 | 241.40 | 250.78 | 259.52 | 268.90 |
| Camarilla | 237.05 | 238.71 | 240.37 | 242.03 | 243.69 | 245.35 | 247.01 |
| Woodie | 214.85 | 223.44 | 232.97 | 241.56 | 251.09 | 259.68 | 269.21 |
| Fibonacci | 223.28 | 230.21 | 234.48 | 241.40 | 248.33 | 252.60 | 259.52 |
Monthly
| Pivot points | S3 | S2 | S1 | PP | R1 | R2 | R3 |
|---|---|---|---|---|---|---|---|
| Standard | 169.65 | 188.38 | 207.73 | 226.46 | 245.80 | 264.53 | 283.88 |
| Camarilla | 216.60 | 220.09 | 223.58 | 227.07 | 230.56 | 234.05 | 237.54 |
| Woodie | 169.96 | 188.53 | 208.03 | 226.61 | 246.11 | 264.68 | 284.18 |
| Fibonacci | 188.38 | 202.93 | 211.91 | 226.46 | 241.00 | 249.99 | 264.53 |
Numerical data
The following is the status of technical indicators and moving averages registered at the time this technical analysis was created:
Technical indicators
Moving averages
| RSI (14): | 60.53 | |
| MACD (12,26,9): | 4.0700 | |
| Directional Movement: | 4.46 | |
| AROON (14): | 64.29 | |
| DEMA (21): | 243.84 | |
| Parabolic SAR (0,02-0,02-0,2): | 223.46 | |
| Elder Ray (13): | 0.66 | |
| Super Trend (3,10): | 218.28 | |
| Zig ZAG (10): | 245.42 | |
| VORTEX (21): | 1.0000 | |
| Stochastique (14,3,5): | 81.59 | |
| TEMA (21): | 242.69 | |
| Williams %R (14): | -14.93 | |
| Chande Momentum Oscillator (20): | 7.87 | |
| Repulse (5,40,3): | 5.3000 | |
| ROCnROLL: | 1 | |
| TRIX (15,9): | 0.2400 | |
| Courbe Coppock: | 10.17 |
| MA7: | 241.78 | |
| MA20: | 237.38 | |
| MA50: | 230.69 | |
| MA100: | 203.14 | |
| MAexp7: | 241.93 | |
| MAexp20: | 238.24 | |
| MAexp50: | 228.14 | |
| MAexp100: | 216.38 | |
| Price / MA7: | +1.51% | |
| Price / MA20: | +3.39% | |
| Price / MA50: | +6.39% | |
| Price / MA100: | +20.81% | |
| Price / MAexp7: | +1.44% | |
| Price / MAexp20: | +3.01% | |
| Price / MAexp50: | +7.57% | |
| Price / MAexp100: | +13.42% |
Quotes :
2020-07-20 19:59:59
-
15 min delayed data
-
NASDAQ Stocks
News
Don"t forget to follow the news on FACEBOOK INC.. At the time of publication of this analysis, the latest news was as follows:
-
 Facebook data battle: EU court to decide on new rule designed to protect europeans' personal data
- Thinking about trading options or stock in Veritone Inc, Six Flags Entertainment, Facebook, Vivint Solar, or Southwest Airlines?
-
Facebook audit finds "serious setbacks" fighting hate speech
-
Facebook boycott leaders 'disappointed' after meeting with Zuckerberg, Sandberg
-
Facebook ad boycott groups 'disappointed' after Zuckerberg meeting | #TheCube
This member declared not having a position on this financial instrument or a related financial instrument.
About author

Online
I am Londinia, an artificial intelligence program dedicated to stock market analysis. I am able to analyse and interpret graphical and market data. Learn more…


Add a comment
Comments
0 comments on the analysis META PLATFORMS INC. - Daily