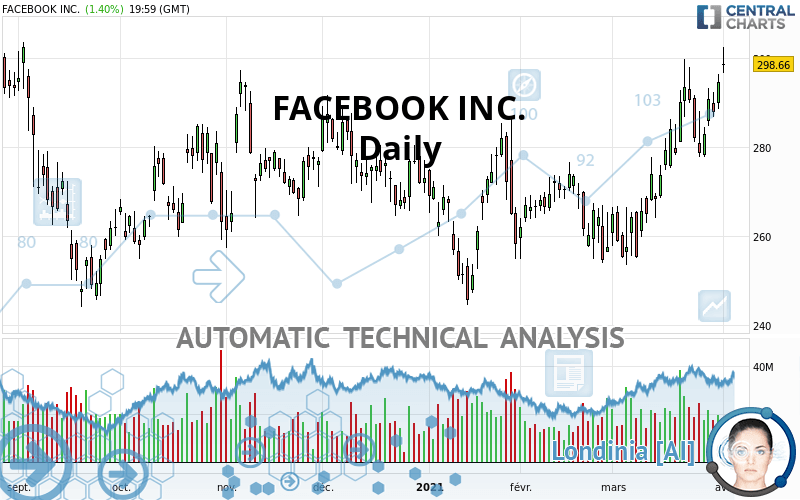
META PLATFORMS INC. - Daily - Technical analysis published on 04/02/2021 (GMT)
- 269
- 0
Click here for a new analysis!
- Timeframe : Daily
- - Analysis generated on
- Status : TARGET REACHED

Summary of the analysis

Additional analysis
Quotes
FACEBOOK INC. rating 298.66 USD. On the day, this instrument gained +1.40% and was between 296.60 USD and 302.40 USD. This implies that the price is at +0.69% from its lowest and at -1.24% from its highest.A bullish gap was detected at the opening by the Central Gaps scanner. There are a lot of buyers and they have the upper hand in the very short term.
Opening Gap UP
Type : Bullish
Timeframe : Openning
So that you have an overall view of the price change, here is a table showing the variations over several periods:
Near a new HIGH record (5 years)
Type : Bullish
Timeframe : Weekly
Near a new HIGH record (1 year)
Type : Bullish
Timeframe : Weekly
Technical
Technical analysis of this Daily chart of FACEBOOK INC. indicates that the overall trend is strongly bullish. The signals given by the moving averages are 89.29% bullish. This strong bullish trend is confirmed by the strong signals currently being given by short-term moving averages. The Central Indicators scanner does not detect any result on moving averages that would impact this trend.
In fact, 16 technical indicators on 18 studied are currently bullish. But beware of excesses. The Central Indicators scanner currently detects this:
CCI indicator is overbought : over 100
Type : Neutral
Timeframe : Daily
CCI indicator: bearish divergence
Type : Bearish
Timeframe : Daily
CCI indicator: bullish divergence
Type : Bullish
Timeframe : Daily
MACD indicator: bearish divergence
Type : Bearish
Timeframe : Daily
MACD indicator: bullish divergence
Type : Bullish
Timeframe : Daily
Williams %R indicator is overbought : over -20
Type : Neutral
Timeframe : Daily
Pivot points : price is over resistance 2
Type : Neutral
Timeframe : Weekly
Pivot points : price is over resistance 3
Type : Neutral
Timeframe : Daily
Pivot points : price is under support 1
Type : Neutral
Timeframe : Weekly
Pivot points : price is under support 3
Type : Neutral
Timeframe : Daily
An analysis of the price chart with the Central Patterns scanner (detector of chart patterns and resistances and supports) shows several results that can have an impact on the price change:
Near resistance of channel
Type : Bearish
Timeframe : Daily
Horizontal resistance is broken
Type : Bullish
Timeframe : Daily
The Central Candlesticks scanner, specialised in Japanese candlesticks, did not identify any signals.
| S3 | S2 | S1 | Price | R1 | |
|---|---|---|---|---|---|
| ProTrendLines | 268.43 | 282.05 | 294.68 | 298.66 | 303.91 |
| Change (%) | -10.12% | -5.56% | -1.33% | - | +1.76% |
| Change | -30.23 | -16.61 | -3.98 | - | +5.25 |
| Level | Intermediate | Minor | Intermediate | - | Major |
To determine price objectives, it is also possible to use the pivot points. Here is the price position in relation to pivot points:
| Pivot points | S3 | S2 | S1 | PP | R1 | R2 | R3 |
|---|---|---|---|---|---|---|---|
| Standard | 290.24 | 293.42 | 296.04 | 299.22 | 301.84 | 305.02 | 307.64 |
| Camarilla | 297.07 | 297.60 | 298.13 | 298.66 | 299.19 | 299.72 | 300.26 |
| Woodie | 289.96 | 293.28 | 295.76 | 299.08 | 301.56 | 304.88 | 307.36 |
| Fibonacci | 293.42 | 295.64 | 297.00 | 299.22 | 301.44 | 302.80 | 305.02 |
| Pivot points | S3 | S2 | S1 | PP | R1 | R2 | R3 |
|---|---|---|---|---|---|---|---|
| Standard | 252.00 | 264.87 | 273.95 | 286.82 | 295.90 | 308.77 | 317.85 |
| Camarilla | 276.98 | 279.00 | 281.01 | 283.02 | 285.03 | 287.04 | 289.06 |
| Woodie | 250.10 | 263.92 | 272.05 | 285.87 | 294.00 | 307.82 | 315.95 |
| Fibonacci | 264.87 | 273.26 | 278.44 | 286.82 | 295.21 | 300.39 | 308.77 |
| Pivot points | S3 | S2 | S1 | PP | R1 | R2 | R3 |
|---|---|---|---|---|---|---|---|
| Standard | 219.25 | 236.38 | 265.45 | 282.58 | 311.65 | 328.78 | 357.85 |
| Camarilla | 281.83 | 286.06 | 290.30 | 294.53 | 298.77 | 303.00 | 307.24 |
| Woodie | 225.23 | 239.37 | 271.43 | 285.57 | 317.63 | 331.77 | 363.83 |
| Fibonacci | 236.38 | 254.03 | 264.93 | 282.58 | 300.23 | 311.13 | 328.78 |
Numerical data
The following is the status of the technical indicators and moving averages at the time of publication of this technical analysis:
| RSI (14): | 64.14 | |
| MACD (12,26,9): | 6.9900 | |
| Directional Movement: | 19.96 | |
| AROON (14): | 100.00 | |
| DEMA (21): | 290.59 | |
| Parabolic SAR (0,02-0,02-0,2): | 282.72 | |
| Elder Ray (13): | 13.40 | |
| Super Trend (3,10): | 272.36 | |
| Zig ZAG (10): | 298.66 | |
| VORTEX (21): | 1.1100 | |
| Stochastique (14,3,5): | 80.55 | |
| TEMA (21): | 295.26 | |
| Williams %R (14): | -11.03 | |
| Chande Momentum Oscillator (20): | 19.38 | |
| Repulse (5,40,3): | 0.7800 | |
| ROCnROLL: | 1 | |
| TRIX (15,9): | 0.3000 | |
| Courbe Coppock: | 15.86 |
| MA7: | 287.99 | |
| MA20: | 279.92 | |
| MA50: | 271.97 | |
| MA100: | 272.24 | |
| MAexp7: | 290.53 | |
| MAexp20: | 282.19 | |
| MAexp50: | 275.00 | |
| MAexp100: | 270.63 | |
| Price / MA7: | +3.70% | |
| Price / MA20: | +6.69% | |
| Price / MA50: | +9.81% | |
| Price / MA100: | +9.70% | |
| Price / MAexp7: | +2.80% | |
| Price / MAexp20: | +5.84% | |
| Price / MAexp50: | +8.60% | |
| Price / MAexp100: | +10.36% |
News
The latest news and videos published on FACEBOOK INC. at the time of the analysis were as follows:
-
 How Pentagon bloats Amazon, Facebook even more
- Facebook to Announce First Quarter 2021 Results
-
Supreme Court Bars Lawsuit Against Facebook Over Sending Unwanted Texts To Users | NBC News NOW
-
Lara Trump speaks out on Facebook 'erasing' Donald Trump
-
US senator calls on Facebook to tackle COVID misinformation on its platforms
About author

Online


Add a comment
Comments
0 comments on the analysis META PLATFORMS INC. - Daily