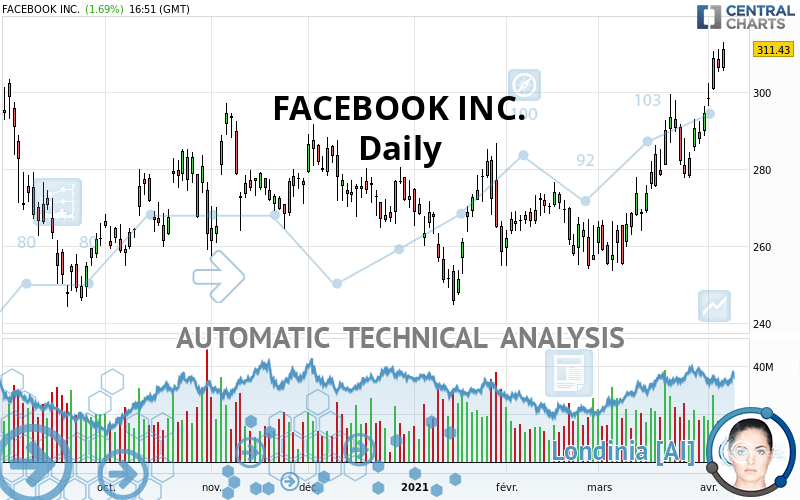
META PLATFORMS INC. - Daily - Technical analysis published on 04/07/2021 (GMT)
- 275
- 0
Click here for a new analysis!
- Timeframe : Daily
- - Analysis generated on
- Status : INVALID
Summary of the analysis

Additional analysis
Quotes
The FACEBOOK INC. price is 311.33 USD. The price has increased by +1.66% since the last closing and was traded between 305.50 USD and 313.14 USD over the period. The price is currently at +1.91% from its lowest and -0.58% from its highest.The Central Gaps scanner detects a bullish opening. A small advantage for buyers in the very short term.
Bullish opening
Type : Bullish
Timeframe : Openning
So that you have an overall view of the price change, here is a table showing the variations over several periods:
New HIGH record (5 years)
Type : Bullish
Timeframe : Weekly
New HIGH record (1 year)
Type : Bullish
Timeframe : Weekly
New HIGH record (1st january)
Type : Bullish
Timeframe : Weekly
New HIGH record (1 month)
Type : Bullish
Timeframe : Weekly
Technical
A technical analysis in Daily of this FACEBOOK INC. chart shows a strongly bullish trend. 92.86% of the signals given by moving averages are bullish. This strongly bullish trend is supported by the strong bullish signals given by short-term moving averages. The Central Indicators scanner does not detect any result on moving averages that would impact this trend.
In fact, 17 technical indicators on 18 studied are currently bullish. Caution: the Central Indicators scanner currently detects an excess:
CCI indicator is overbought : over 100
Type : Neutral
Timeframe : Daily
Previous candle closed over Bollinger bands
Type : Neutral
Timeframe : Daily
CCI indicator: bearish divergence
Type : Bearish
Timeframe : Daily
CCI indicator: bullish divergence
Type : Bullish
Timeframe : Daily
MACD indicator: bullish divergence
Type : Bullish
Timeframe : Daily
Williams %R indicator is overbought : over -20
Type : Neutral
Timeframe : Daily
Pivot points : price is over resistance 2
Type : Neutral
Timeframe : Weekly
Pivot points : price is over resistance 3
Type : Neutral
Timeframe : Daily
Pivot points : price is under support 1
Type : Neutral
Timeframe : Weekly
Pivot points : price is under support 3
Type : Neutral
Timeframe : Daily
Central Patterns, the market scanner focusing on chart patterns, resistances and supports found these results:
Near horizontal resistance
Type : Bearish
Timeframe : Daily
Resistance of channel is broken
Type : Bullish
Timeframe : Daily
The presence of a bearish pattern in Japanese candlesticks detected by Central Candlesticks that could cause a correction in the very short term was also detected:
Bearish harami
Type : Bearish
Timeframe : Daily
| S3 | S2 | S1 | Price | |
|---|---|---|---|---|
| ProTrendLines | 268.43 | 282.05 | 303.91 | 311.33 |
| Change (%) | -13.78% | -9.40% | -2.38% | - |
| Change | -42.90 | -29.28 | -7.42 | - |
| Level | Intermediate | Major | Major | - |
To determine price objectives, it is also possible to use the pivot points. Here is the price position in relation to pivot points:
| Pivot points | S3 | S2 | S1 | PP | R1 | R2 | R3 |
|---|---|---|---|---|---|---|---|
| Standard | 297.79 | 301.52 | 303.89 | 307.62 | 309.99 | 313.72 | 316.09 |
| Camarilla | 304.58 | 305.14 | 305.70 | 306.26 | 306.82 | 307.38 | 307.94 |
| Woodie | 297.11 | 301.18 | 303.21 | 307.28 | 309.31 | 313.38 | 315.41 |
| Fibonacci | 301.52 | 303.85 | 305.29 | 307.62 | 309.95 | 311.39 | 313.72 |
| Pivot points | S3 | S2 | S1 | PP | R1 | R2 | R3 |
|---|---|---|---|---|---|---|---|
| Standard | 270.41 | 277.55 | 288.11 | 295.25 | 305.81 | 312.95 | 323.51 |
| Camarilla | 293.79 | 295.42 | 297.04 | 298.66 | 300.28 | 301.91 | 303.53 |
| Woodie | 272.11 | 278.41 | 289.81 | 296.11 | 307.51 | 313.81 | 325.21 |
| Fibonacci | 277.55 | 284.32 | 288.49 | 295.25 | 302.02 | 306.19 | 312.95 |
| Pivot points | S3 | S2 | S1 | PP | R1 | R2 | R3 |
|---|---|---|---|---|---|---|---|
| Standard | 219.25 | 236.38 | 265.45 | 282.58 | 311.65 | 328.78 | 357.85 |
| Camarilla | 281.83 | 286.06 | 290.30 | 294.53 | 298.77 | 303.00 | 307.24 |
| Woodie | 225.23 | 239.37 | 271.43 | 285.57 | 317.63 | 331.77 | 363.83 |
| Fibonacci | 236.38 | 254.03 | 264.93 | 282.58 | 300.23 | 311.13 | 328.78 |
Numerical data
The following are the details of the technical indicators and moving averages that were collected to generate this technical analysis:
| RSI (14): | 68.56 | |
| MACD (12,26,9): | 9.7100 | |
| Directional Movement: | 23.79 | |
| AROON (14): | 100.00 | |
| DEMA (21): | 300.67 | |
| Parabolic SAR (0,02-0,02-0,2): | 293.45 | |
| Elder Ray (13): | 14.80 | |
| Super Trend (3,10): | 282.65 | |
| Zig ZAG (10): | 310.97 | |
| VORTEX (21): | 1.1500 | |
| Stochastique (14,3,5): | 91.65 | |
| TEMA (21): | 306.94 | |
| Williams %R (14): | -6.16 | |
| Chande Momentum Oscillator (20): | 20.88 | |
| Repulse (5,40,3): | 2.3800 | |
| ROCnROLL: | 1 | |
| TRIX (15,9): | 0.3900 | |
| Courbe Coppock: | 16.32 |
| MA7: | 299.70 | |
| MA20: | 286.97 | |
| MA50: | 273.99 | |
| MA100: | 273.06 | |
| MAexp7: | 301.15 | |
| MAexp20: | 289.06 | |
| MAexp50: | 278.81 | |
| MAexp100: | 272.80 | |
| Price / MA7: | +3.88% | |
| Price / MA20: | +8.49% | |
| Price / MA50: | +13.63% | |
| Price / MA100: | +14.02% | |
| Price / MAexp7: | +3.38% | |
| Price / MAexp20: | +7.70% | |
| Price / MAexp50: | +11.66% | |
| Price / MAexp100: | +14.12% |
News
The last news published on FACEBOOK INC. at the time of the generation of this analysis was as follows:
-
 Human Smugglers Use Facebook To Connect With Migrants Seeking Refuge In U.S. | NBC News NOW
-
Human Smugglers Turning To Facebook To Prey On Migrants Seeking Refuge | NBC News NOW
-
LIVE | GameStop, Tesla, Facebook, Yellen: Jim Cramer's Stock Market Breakdown
-
How Pentagon bloats Amazon, Facebook even more
- Facebook to Announce First Quarter 2021 Results
About author

Online


Add a comment
Comments
0 comments on the analysis META PLATFORMS INC. - Daily