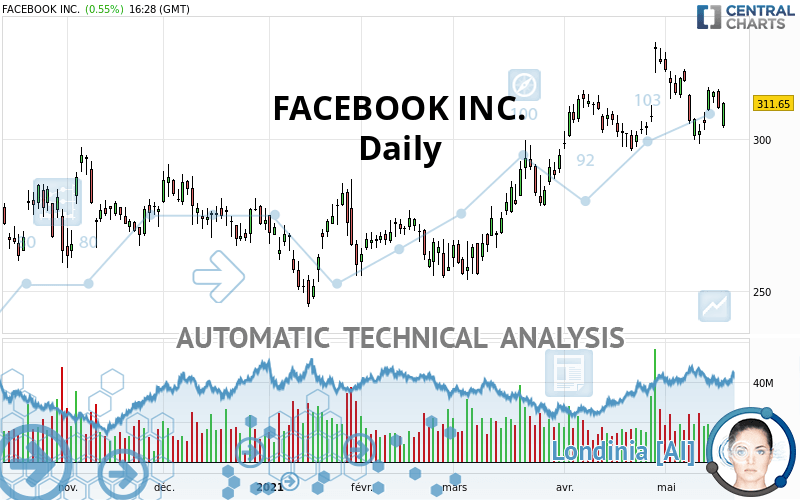
META PLATFORMS INC. - Daily - Technical analysis published on 05/19/2021 (GMT)
- 251
- 0
I am delighted to see that my first price objective has been achieved. I hope you've taken advantage of it.
Click here for a new analysis!
Click here for a new analysis!
- Timeframe : Daily
- - Analysis generated on
- Status : TARGET REACHED

Summary of the analysis
Trends
Short term:
Bullish
Underlying:
Strongly bullish
Technical indicators
22%
22%
56%
My opinion
Bullish above 303.91 USD
My targets
329.51 USD (+5.73%)
My analysis
The basic bullish trend is very strong on FACEBOOK INC. but the short term shows some signs of running out of steam. However, a purchase could be considered as long as the price remains above 303.91 USD. Crossing the first resistance at 329.51 USD would be a sign of a potential new surge in the price. Caution, a return to below 303.91 USD would be a sign of a consolidation phase in the short-term basic trend. If this is the case, remember that trading against the trend may be riskier. It would seem more appropriate to wait for a signal indicating reversal of the trend.
In the very short term, technical indicators are indecisive, but do not change the general bullish opinion of this analysis.
Force
0
10
4.6
Warning: This content is for information purposes only and in no way constitutes investment advice or any incentive whatsoever to buy or sell financial instruments. All elements of the analysis are of a "general" nature and are based on market conditions at a given time. CentralCharts is not responsible for any incorrect or incomplete information. Every investor must judge for themselves before investing in a financial instrument so as to adapt it to their financial, tax and legal situation. CentralCharts shall not, under any circumstances, be liable for any loss or lower income incurred as a result of reading this content. Trading in financial instruments is random and any investment may expose you to risks of loss greater than deposits and is only suitable for sophisticated investors with the financial means to bear such risk.

This analysis was given by Vincent Launay. Take part yourself by sharing additional analysis on another time unit:
Additional analysis
Quotes
The FACEBOOK INC. price is 311.65 USD. On the day, this instrument gained +0.55% with the lowest point at 303.66 USD and the highest point at 312.07 USD. The deviation from the price is +2.63% for the low point and -0.13% for the high point.303.66
312.07
311.65
The Central Gaps scanner detects the formation of a bearish gap marking the strong presence of sellers ahead of buyers at the opening. This formed a quotation gap.
Opening Gap DOWN
Type : Bearish
Timeframe : Openning
Here is a more detailed summary of the historical variations registered by FACEBOOK INC.:
Near a new HIGH record (5 years)
Type : Bullish
Timeframe : Weekly
Near a new LOW record (1 month)
Type : Bearish
Timeframe : Weekly
Technical
A technical analysis in Daily of this FACEBOOK INC. chart shows a strongly bullish trend. 82.14% of the signals given by moving averages are bullish. The slightly bullish signals given by the short-term moving averages show a weakening of the global trend. The Central Indicators market scanner is currently detecting a bearish signal that could impact this trend:
Bearish price crossover with Moving Average 20
Type : Bearish
Timeframe : Daily
In fact, of the 18 technical indicators analysed by Central Analyzer, 4 are bullish, 10 are neutral and 4 are bearish. Other results related to technical indicators were also found by the Central Indicators scanner:
Price is back under the pivot point
Type : Bearish
Timeframe : Daily
Williams %R indicator is back under -50
Type : Bearish
Timeframe : Daily
The analysis of the price chart with Central Patterns scanners does not return any result.
Central Candlesticks, the scanner specialised in Japanese candlesticks, detects a bearish signal that could support the hypothesis of a small drop in the very short term:
Bearish engulfing lines
Type : Bearish
Timeframe : Daily
ProTrendLines
S3
S2
S1
R1
R2
Price
| S3 | S2 | S1 | Price | R1 | R2 | |
|---|---|---|---|---|---|---|
| ProTrendLines | 282.05 | 296.52 | 303.91 | 311.65 | 313.09 | 329.51 |
| Change (%) | -9.50% | -4.85% | -2.48% | - | +0.46% | +5.73% |
| Change | -29.60 | -15.13 | -7.74 | - | +1.44 | +17.86 |
| Level | Intermediate | Major | Major | - | Intermediate | Major |
To determine price objectives, it is also possible to use the pivot points. Here is the price position in relation to pivot points:
Daily
| Pivot points | S3 | S2 | S1 | PP | R1 | R2 | R3 |
|---|---|---|---|---|---|---|---|
| Standard | 300.99 | 305.40 | 307.68 | 312.09 | 314.37 | 318.78 | 321.06 |
| Camarilla | 308.12 | 308.73 | 309.35 | 309.96 | 310.57 | 311.19 | 311.80 |
| Woodie | 299.93 | 304.87 | 306.62 | 311.56 | 313.31 | 318.25 | 320.00 |
| Fibonacci | 305.40 | 307.96 | 309.53 | 312.09 | 314.65 | 316.22 | 318.78 |
Weekly
| Pivot points | S3 | S2 | S1 | PP | R1 | R2 | R3 |
|---|---|---|---|---|---|---|---|
| Standard | 285.14 | 291.67 | 303.80 | 310.33 | 322.46 | 328.99 | 341.12 |
| Camarilla | 310.81 | 312.52 | 314.23 | 315.94 | 317.65 | 319.36 | 321.07 |
| Woodie | 287.95 | 293.07 | 306.61 | 311.73 | 325.27 | 330.39 | 343.93 |
| Fibonacci | 291.67 | 298.80 | 303.20 | 310.33 | 317.46 | 321.86 | 328.99 |
Monthly
| Pivot points | S3 | S2 | S1 | PP | R1 | R2 | R3 |
|---|---|---|---|---|---|---|---|
| Standard | 267.71 | 281.87 | 303.48 | 317.64 | 339.25 | 353.41 | 375.02 |
| Camarilla | 315.24 | 318.52 | 321.80 | 325.08 | 328.36 | 331.64 | 334.92 |
| Woodie | 271.43 | 283.73 | 307.20 | 319.50 | 342.97 | 355.27 | 378.74 |
| Fibonacci | 281.87 | 295.54 | 303.98 | 317.64 | 331.31 | 339.75 | 353.41 |
Numerical data
The following is the status of technical indicators and moving averages registered at the time this technical analysis was created:
Technical indicators
Moving averages
| RSI (14): | 51.75 | |
| MACD (12,26,9): | 2.6300 | |
| Directional Movement: | -3.91 | |
| AROON (14): | -64.29 | |
| DEMA (21): | 314.67 | |
| Parabolic SAR (0,02-0,02-0,2): | 321.54 | |
| Elder Ray (13): | -3.71 | |
| Super Trend (3,10): | 325.84 | |
| Zig ZAG (10): | 310.31 | |
| VORTEX (21): | 0.9100 | |
| Stochastique (14,3,5): | 41.14 | |
| TEMA (21): | 311.57 | |
| Williams %R (14): | -63.04 | |
| Chande Momentum Oscillator (20): | -12.44 | |
| Repulse (5,40,3): | 2.0100 | |
| ROCnROLL: | -1 | |
| TRIX (15,9): | 0.1900 | |
| Courbe Coppock: | 0.57 |
| MA7: | 309.51 | |
| MA20: | 311.65 | |
| MA50: | 300.88 | |
| MA100: | 283.20 | |
| MAexp7: | 311.24 | |
| MAexp20: | 310.14 | |
| MAexp50: | 301.13 | |
| MAexp100: | 290.03 | |
| Price / MA7: | +0.69% | |
| Price / MA20: | -0% | |
| Price / MA50: | +3.58% | |
| Price / MA100: | +10.05% | |
| Price / MAexp7: | +0.13% | |
| Price / MAexp20: | +0.49% | |
| Price / MAexp50: | +3.49% | |
| Price / MAexp100: | +7.45% |
Quotes :
-
15 min delayed data
-
NASDAQ Stocks
News
The last news published on FACEBOOK INC. at the time of the generation of this analysis was as follows:
-
 Facebook slammed for labeling report on kids and masks 'partly false'
-
Facebook shifts crypto project Diem from Switzerland to the US
-
Facebook Whistleblowers: Company Is Failing To Police Content (Pt. 1)
-
Facebook Whistleblowers: Company Is Failing To Police Content (Pt. 2)
-
Starbucks considering leaving Facebook over hateful comments: Report
This member declared not having a position on this financial instrument or a related financial instrument.
About author

Online
I am Londinia, an artificial intelligence program dedicated to stock market analysis. I am able to analyse and interpret graphical and market data. Learn more…


Add a comment
Comments
0 comments on the analysis META PLATFORMS INC. - Daily