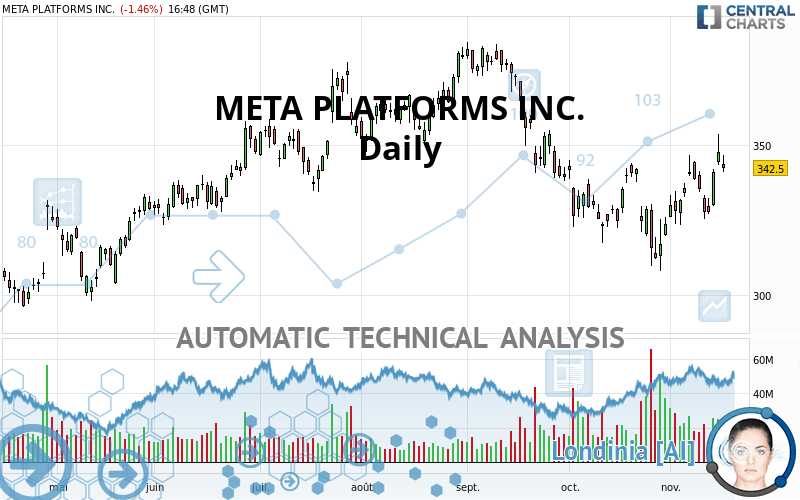
META PLATFORMS INC. - Daily - Technical analysis published on 11/16/2021 (GMT)
- 227
- 0
Click here for a new analysis!
- Timeframe : Daily
- - Analysis generated on
- Status : INVALID

Summary of the analysis

Additional analysis
Quotes
The META PLATFORMS INC. price is 342.50 USD. On the day, this instrument lost -1.46% with the lowest point at 340.87 USD and the highest point at 346.65 USD. The deviation from the price is +0.48% for the low point and -1.20% for the high point.The Central Gaps scanner detects a bearish opening. A small advantage for sellers in the very short term.
Bearish opening
Type : Bearish
Timeframe : Openning
A study of price movements over other periods shows the following variations:
Near a new HIGH record (1 month)
Type : Bullish
Timeframe : Weekly
Technical
Technical analysis of META PLATFORMS INC. in Daily shows an overall slightly bullish trend. 60.71% of the signals given by moving averages are bullish. This slightly bullish trend could be reinforced by the strong bullish signals given by short-term moving averages. The Central Indicators scanner detects bullish signals on moving averages that could impact this trend:
Bullish price crossover with Moving Average 50
Type : Bullish
Timeframe : Daily
Bullish price crossover with adaptative moving average 50
Type : Bullish
Timeframe : Daily
An assessment of technical indicators shows a strong bullish signal.
But beware of excesses. The Central Indicators scanner currently detects this:
CCI indicator is overbought : over 100
Type : Neutral
Timeframe : Daily
Williams %R indicator is overbought : over -20
Type : Neutral
Timeframe : Daily
Pivot points : price is under support 1
Type : Neutral
Timeframe : Daily
SuperTrend indicator bullish reversal
Type : Bullish
Timeframe : Daily
MACD indicator is back over 0
Type : Bullish
Timeframe : Daily
An analysis of the price chart with the Central Patterns scanner (detector of chart patterns and resistances and supports) shows several results that can have an impact on the price change:
Near horizontal resistance
Type : Bearish
Timeframe : Daily
Resistance of channel is broken
Type : Bullish
Timeframe : Daily
Resistance of triangle is broken
Type : Bullish
Timeframe : Daily
Central Candlesticks, the scanner specialised in Japanese candlesticks, detects a bullish signal that could support the hypothesis of a small rebound in the very short term:
Upside gap
Type : Bullish
Timeframe : Daily
| S3 | S2 | S1 | Price | R1 | R2 | |
|---|---|---|---|---|---|---|
| ProTrendLines | 273.97 | 303.91 | 336.95 | 342.50 | 355.30 | 382.18 |
| Change (%) | -20.01% | -11.27% | -1.62% | - | +3.74% | +11.59% |
| Change | -68.53 | -38.59 | -5.55 | - | +12.80 | +39.68 |
| Level | Minor | Major | Major | - | Intermediate | Major |
To determine price objectives, it is also possible to use the pivot points. Here is the price position in relation to pivot points:
| Pivot points | S3 | S2 | S1 | PP | R1 | R2 | R3 |
|---|---|---|---|---|---|---|---|
| Standard | 332.17 | 337.69 | 342.62 | 348.14 | 353.07 | 358.59 | 363.52 |
| Camarilla | 344.69 | 345.64 | 346.60 | 347.56 | 348.52 | 349.48 | 350.43 |
| Woodie | 331.89 | 337.54 | 342.34 | 347.99 | 352.79 | 358.44 | 363.24 |
| Fibonacci | 337.69 | 341.68 | 344.15 | 348.14 | 352.13 | 354.60 | 358.59 |
| Pivot points | S3 | S2 | S1 | PP | R1 | R2 | R3 |
|---|---|---|---|---|---|---|---|
| Standard | 310.06 | 317.78 | 329.34 | 337.06 | 348.62 | 356.34 | 367.90 |
| Camarilla | 335.59 | 337.36 | 339.12 | 340.89 | 342.66 | 344.43 | 346.19 |
| Woodie | 311.97 | 318.74 | 331.25 | 338.02 | 350.53 | 357.30 | 369.81 |
| Fibonacci | 317.78 | 325.15 | 329.70 | 337.06 | 344.43 | 348.98 | 356.34 |
| Pivot points | S3 | S2 | S1 | PP | R1 | R2 | R3 |
|---|---|---|---|---|---|---|---|
| Standard | 269.20 | 288.66 | 306.11 | 325.57 | 343.02 | 362.48 | 379.93 |
| Camarilla | 313.42 | 316.80 | 320.19 | 323.57 | 326.95 | 330.34 | 333.72 |
| Woodie | 268.21 | 288.16 | 305.12 | 325.07 | 342.03 | 361.98 | 378.94 |
| Fibonacci | 288.66 | 302.76 | 311.47 | 325.57 | 339.67 | 348.38 | 362.48 |
Numerical data
The following are the details of the technical indicators and moving averages that were collected to generate this technical analysis:
| RSI (14): | 55.24 | |
| MACD (12,26,9): | 0.8300 | |
| Directional Movement: | 7.17 | |
| AROON (14): | 85.72 | |
| DEMA (21): | 334.27 | |
| Parabolic SAR (0,02-0,02-0,2): | 324.17 | |
| Elder Ray (13): | 8.06 | |
| Super Trend (3,10): | 319.09 | |
| Zig ZAG (10): | 342.30 | |
| VORTEX (21): | 1.0000 | |
| Stochastique (14,3,5): | 81.95 | |
| TEMA (21): | 339.49 | |
| Williams %R (14): | -24.48 | |
| Chande Momentum Oscillator (20): | 18.94 | |
| Repulse (5,40,3): | 0.1000 | |
| ROCnROLL: | 1 | |
| TRIX (15,9): | -0.0800 | |
| Courbe Coppock: | 8.11 |
| MA7: | 337.24 | |
| MA20: | 331.54 | |
| MA50: | 341.13 | |
| MA100: | 350.35 | |
| MAexp7: | 338.69 | |
| MAexp20: | 334.79 | |
| MAexp50: | 339.05 | |
| MAexp100: | 339.54 | |
| Price / MA7: | +1.56% | |
| Price / MA20: | +3.31% | |
| Price / MA50: | +0.40% | |
| Price / MA100: | -2.24% | |
| Price / MAexp7: | +1.12% | |
| Price / MAexp20: | +2.30% | |
| Price / MAexp50: | +1.02% | |
| Price / MAexp100: | +0.87% |
News
Don't forget to follow the news on META PLATFORMS INC.. At the time of publication of this analysis, the latest news was as follows:
- Thinking about trading options or stock in Meta Platforms, Roblox Corp, CyrusOne, Snap, or Boeing?
- ROSEN, GLOBALLY RESPECTED INVESTOR COUNSEL, Encourages Meta Platforms, Inc. f/k/a Facebook, Inc. Investors with Losses to Secure Counsel Before Important Deadline in Securities Class Action Commenced by the Firm - FB
- FB INVESTOR ALERT: ROSEN, A LEADING LAW FIRM, Encourages Meta Platforms, Inc. f/k/a Facebook, Inc. Investors with Losses Exceeding $100K to Secure Counsel Before Important Deadline in Securities Class Action First Filed by Firm - FB
- SHAREHOLDER ACTION NOTICE: The Schall Law Firm Reminds Investors of a Class Action Lawsuit Against Meta Platforms, Inc. f/k/a Facebook, Inc. and Encourages Investors with Losses in Excess of $100,000 to Contact the Firm
- SHAREHOLDER ACTION ALERT: The Schall Law Firm Reminds Investors of a Class Action Lawsuit Against Meta Platforms, Inc. f/k/a Facebook, Inc. and Encourages Investors with Losses in Excess of $100,000 to Contact the Firm
About author

Online


Add a comment
Comments
0 comments on the analysis META PLATFORMS INC. - Daily