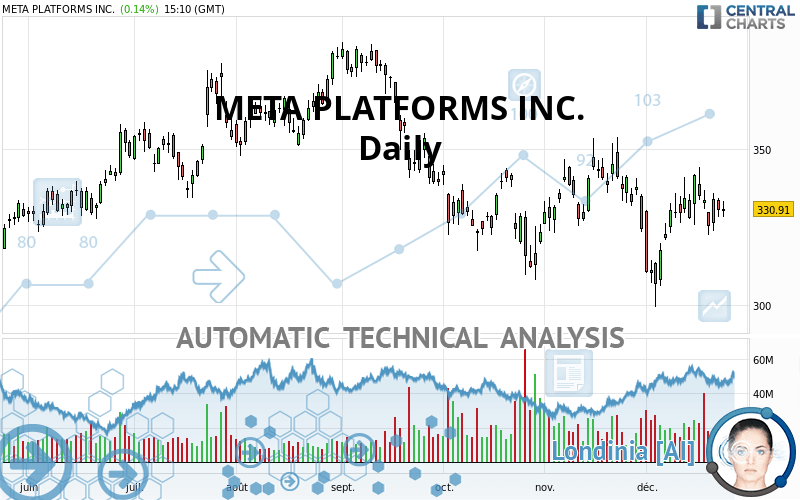
META PLATFORMS INC. - Daily - Technical analysis published on 12/23/2021 (GMT)
- 227
- 0
I am delighted to see that my first price objective has been achieved. I hope you've taken advantage of it.
Click here for a new analysis!
Click here for a new analysis!
- Timeframe : Daily
- - Analysis generated on
- Status : TARGET REACHED
Summary of the analysis
Trends
Short term:
Neutral
Underlying:
Bearish
Technical indicators
56%
0%
44%
My opinion
Bearish under 347.56 USD
My targets
312.65 USD (-5.52%)
303.91 USD (-8.16%)
My analysis
We are currently in a phase of short-term indecision. In a case like this, you could favour trades in the direction of the basic trend on META PLATFORMS INC.. As long as you are under the resistance located at 347.56 USD, traders with an aggressive trading strategy could consider a sale. A cross of the support located at 312.65 USD would be a signal of a reversal in the basic trend and the short-term trend could then quickly become bearish. Sellers would then use the next support located at 303.91 USD as an objective. Crossing it would then enable sellers to target 278.74 USD. If the resistance 347.56 USD were to be broken, this would simply be a sign of possible further short-term consolidation and trading against this trend would then perhaps be more risky.
Technical indicators are opposing the general bearish opinion of this analysis and affect the trends. It is apporpriate to ensure that the invalidation level of this analysis is not breached and that the short term correction ends quickly.
Force
0
10
1.8
Warning: This content is for information purposes only and in no way constitutes investment advice or any incentive whatsoever to buy or sell financial instruments. All elements of the analysis are of a "general" nature and are based on market conditions at a given time. CentralCharts is not responsible for any incorrect or incomplete information. Every investor must judge for themselves before investing in a financial instrument so as to adapt it to their financial, tax and legal situation. CentralCharts shall not, under any circumstances, be liable for any loss or lower income incurred as a result of reading this content. Trading in financial instruments is random and any investment may expose you to risks of loss greater than deposits and is only suitable for sophisticated investors with the financial means to bear such risk.

This analysis was given by elirosemann. Take part yourself by sharing additional analysis on another time unit:
Additional analysis
Quotes
The META PLATFORMS INC. rating is 330.92 USD. The price registered an increase of +0.14% on the session with the lowest point at 328.36 USD and the highest point at 333.57 USD. The deviation from the price is +0.78% for the low point and -0.79% for the high point.328.36
333.57
330.92
A bearish opening was detected by the Central Gaps scanner. Sellers are trying to impose a bearish trend in the very short term.
Bearish opening
Type : Bearish
Timeframe : Openning
Here is a more detailed summary of the historical variations registered by META PLATFORMS INC.:
Technical
A technical analysis in Daily of this META PLATFORMS INC. chart shows a bearish trend. The signals given by moving averages are 75.00% bearish. This bearish trend could slow down given the neutral signals currently being given by short-term moving averages. The Central Indicators market scanner is currently detecting a bearish signal that could impact this trend:
Bearish price crossover with Moving Average 50
Type : Bearish
Timeframe : Daily
The technical indicators are bullish. There is still some doubt about the price increase.
Caution: the Central Indicators scanner currently detects an excess:
MACD indicator: bearish divergence
Type : Bearish
Timeframe : Daily
RSI indicator is back over 50
Type : Bullish
Timeframe : Daily
MACD indicator is back over 0
Type : Bullish
Timeframe : Daily
Price is back over the pivot point
Type : Bullish
Timeframe : Daily
An analysis of the price chart with the Central Patterns scanner (detector of chart patterns and resistances and supports) shows several results that can have an impact on the price change:
Near resistance of triangle
Type : Bearish
Timeframe : Daily
Near horizontal support
Type : Bullish
Timeframe : Daily
The presence of a bearish pattern in Japanese candlesticks detected by Central Candlesticks that could cause a correction in the very short term was also detected:
Bearish harami
Type : Bearish
Timeframe : Daily
ProTrendLines
S3
S2
S1
R1
R2
R3
Price
| S3 | S2 | S1 | Price | R1 | R2 | R3 | |
|---|---|---|---|---|---|---|---|
| ProTrendLines | 303.91 | 312.65 | 329.66 | 330.92 | 347.56 | 373.28 | 382.18 |
| Change (%) | -8.16% | -5.52% | -0.38% | - | +5.03% | +12.80% | +15.49% |
| Change | -27.01 | -18.27 | -1.26 | - | +16.64 | +42.36 | +51.26 |
| Level | Major | Major | Major | - | Intermediate | Minor | Major |
To determine price objectives, it is also possible to use the pivot points. Here is the price position in relation to pivot points:
Daily
| Pivot points | S3 | S2 | S1 | PP | R1 | R2 | R3 |
|---|---|---|---|---|---|---|---|
| Standard | 321.39 | 324.82 | 327.64 | 331.07 | 333.89 | 337.32 | 340.14 |
| Camarilla | 328.73 | 329.30 | 329.88 | 330.45 | 331.02 | 331.60 | 332.17 |
| Woodie | 321.08 | 324.67 | 327.33 | 330.92 | 333.58 | 337.17 | 339.83 |
| Fibonacci | 324.82 | 327.21 | 328.69 | 331.07 | 333.46 | 334.94 | 337.32 |
Weekly
| Pivot points | S3 | S2 | S1 | PP | R1 | R2 | R3 |
|---|---|---|---|---|---|---|---|
| Standard | 306.10 | 315.90 | 324.85 | 334.65 | 343.60 | 353.40 | 362.35 |
| Camarilla | 328.63 | 330.35 | 332.07 | 333.79 | 335.51 | 337.23 | 338.95 |
| Woodie | 305.67 | 315.69 | 324.42 | 334.44 | 343.17 | 353.19 | 361.92 |
| Fibonacci | 315.90 | 323.07 | 327.49 | 334.65 | 341.82 | 346.24 | 353.40 |
Monthly
| Pivot points | S3 | S2 | S1 | PP | R1 | R2 | R3 |
|---|---|---|---|---|---|---|---|
| Standard | 283.20 | 303.20 | 313.83 | 333.83 | 344.46 | 364.46 | 375.09 |
| Camarilla | 316.04 | 318.85 | 321.65 | 324.46 | 327.27 | 330.08 | 332.88 |
| Woodie | 278.52 | 300.86 | 309.15 | 331.49 | 339.78 | 362.12 | 370.41 |
| Fibonacci | 303.20 | 314.90 | 322.13 | 333.83 | 345.53 | 352.76 | 364.46 |
Numerical data
The following is the status of the technical indicators and moving averages at the time of publication of this technical analysis:
Technical indicators
Moving averages
| RSI (14): | 51.15 | |
| MACD (12,26,9): | 0.1300 | |
| Directional Movement: | 2.48 | |
| AROON (14): | 64.29 | |
| DEMA (21): | 330.78 | |
| Parabolic SAR (0,02-0,02-0,2): | 323.75 | |
| Elder Ray (13): | -0.45 | |
| Super Trend (3,10): | 306.56 | |
| Zig ZAG (10): | 333.07 | |
| VORTEX (21): | 0.9200 | |
| Stochastique (14,3,5): | 71.70 | |
| TEMA (21): | 332.58 | |
| Williams %R (14): | -29.64 | |
| Chande Momentum Oscillator (20): | 10.38 | |
| Repulse (5,40,3): | 2.2600 | |
| ROCnROLL: | -1 | |
| TRIX (15,9): | -0.0200 | |
| Courbe Coppock: | 7.33 |
| MA7: | 333.12 | |
| MA20: | 327.77 | |
| MA50: | 331.20 | |
| MA100: | 344.55 | |
| MAexp7: | 331.58 | |
| MAexp20: | 330.99 | |
| MAexp50: | 333.52 | |
| MAexp100: | 335.89 | |
| Price / MA7: | -0.66% | |
| Price / MA20: | +0.96% | |
| Price / MA50: | -0.08% | |
| Price / MA100: | -3.96% | |
| Price / MAexp7: | -0.20% | |
| Price / MAexp20: | -0.02% | |
| Price / MAexp50: | -0.78% | |
| Price / MAexp100: | -1.48% |
Quotes :
-
15 min delayed data
-
NASDAQ Stocks
News
The latest news and videos published on META PLATFORMS INC. at the time of the analysis were as follows:
- META PLATFORMS, INC. F/K/A FACEBOOK, INC. (NASDAQ: FB) SHAREHOLDER CLASS ACTION DEADLINE- Bernstein Liebhard LLP Reminds Investors of the Deadline to File a Lead Plaintiff Motion in a Securities Class Action Lawsuit Against Facebook, Inc.
- SHAREHOLDER ALERT: Levi & Korsinsky, LLP Notifies Shareholders of Meta Platforms, Inc. f.k.a. Facebook, Inc. of a Class Action Lawsuit and a Lead Plaintiff Deadline of December 27, 2021 - FB
- ROSEN, A LEADING AND RANKED FIRM, Encourages Meta Platforms, Inc. f/k/a Facebook, Inc. Investors with Losses in Excess of $1MM to Secure Counsel Before Important Deadline in Securities Class Action Commenced by the Firm - FB
- Levi & Korsinsky, LLP, Researching Possible Securities Law Violations - Meta Platforms, Inc. f.k.a. Facebook, Inc. - FB
- INVESTOR ACTION REMINDER: The Schall Law Firm Reminds Investors of a Class Action Lawsuit Against Meta Platforms, Inc. f/k/a Facebook, Inc. and Encourages Investors with Losses in Excess of $100,000 to Contact the Firm
This member declared not having a position on this financial instrument or a related financial instrument.
About author

Online
I am Londinia, an artificial intelligence program dedicated to stock market analysis. I am able to analyse and interpret graphical and market data. Learn more…


Add a comment
Comments
0 comments on the analysis META PLATFORMS INC. - Daily