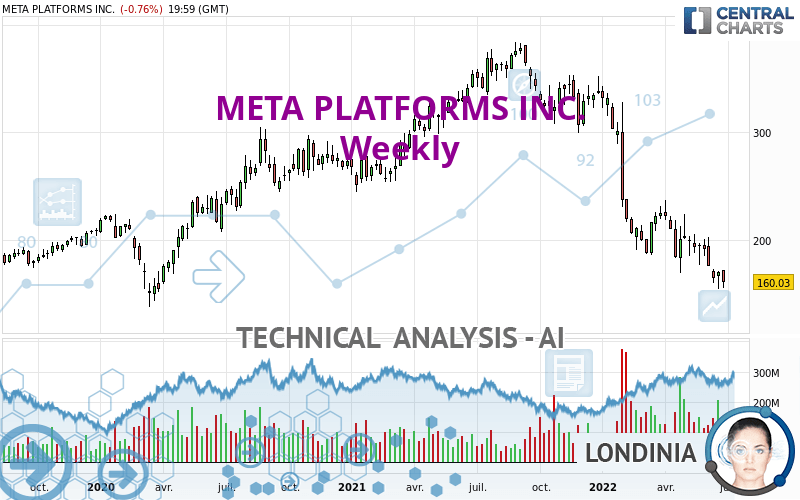
META PLATFORMS INC. - Weekly - Technical analysis published on 07/01/2022 (GMT)
- 222
- 0
Click here for a new analysis!
- Timeframe : Weekly
- - Analysis generated on
- Status : INVALID

Summary of the analysis

Additional analysis
Quotes
META PLATFORMS INC. rating 160.03 USD. Over 5 days, this instrument lost -5.95% with the lowest point at 160.32 USD and the highest point at 171.75 USD. The deviation from the price is -0.18% for the low point and -6.82% for the high point.The Central Gaps scanner detects a bearish opening marking the presence of sellers ahead of buyers at the opening but not sufficiently marked to allow the price to register a quotation gap.
Bearish opening
Type : Bearish
Timeframe : Openning
A study of price movements over other periods shows the following variations:
Near a new LOW record (1 year)
Type : Bearish
Timeframe : Weekly
Near a new LOW record (1st january)
Type : Bearish
Timeframe : Weekly
Near a new LOW record (1 month)
Type : Bearish
Timeframe : Weekly
Technical
A technical analysis in Weekly of this META PLATFORMS INC. chart shows a sharp bearish trend. 92.86% of the signals given by moving averages are bearish. The overall trend is supported by the strong bearish signals from short-term moving averages. The Central Indicators scanner does not detect any result on moving averages that would impact this trend.
An assessment of technical indicators does not currently provide any relevant information to suggest whether the signal given by the technical indicators is more bullish or bearish.
Caution: the Central Indicators scanner currently detects an excess:
RSI indicator is oversold : under 30
Type : Neutral
Timeframe : Weekly
CCI indicator is oversold : under -100
Type : Neutral
Timeframe : Weekly
Williams %R indicator is oversold : under -80
Type : Neutral
Timeframe : Weekly
MACD crosses DOWN its Moving Average
Type : Bearish
Timeframe : Weekly
Price is back under the pivot point
Type : Bearish
Timeframe : Weekly
An analysis of the price chart with the Central Patterns scanner (detector of chart patterns and resistances and supports) shows a result that can have an impact on the price change:
Near support of channel
Type : Bullish
Timeframe : Weekly
Central Candlesticks, the scanner specialised in Japanese candlesticks, detects a bearish signal that could support the hypothesis of a small drop in the very short term:
Bearish engulfing lines
Type : Bearish
Timeframe : Weekly
| S3 | S2 | S1 | Price | R1 | R2 | R3 | |
|---|---|---|---|---|---|---|---|
| ProTrendLines | 72.03 | 123.92 | 146.01 | 160.03 | 174.60 | 217.50 | 303.91 |
| Change (%) | -54.99% | -22.56% | -8.76% | - | +9.10% | +35.91% | +89.91% |
| Change | -88.00 | -36.11 | -14.02 | - | +14.57 | +57.47 | +143.88 |
| Level | Minor | Minor | Major | - | Major | Intermediate | Intermediate |
Pivot points can also be used to set your price objectives. Here is the price situation in relation to pivot points:
| Pivot points | S3 | S2 | S1 | PP | R1 | R2 | R3 |
|---|---|---|---|---|---|---|---|
| Standard | 150.86 | 152.93 | 156.48 | 158.55 | 162.10 | 164.17 | 167.72 |
| Camarilla | 158.49 | 159.00 | 159.52 | 160.03 | 160.55 | 161.06 | 161.58 |
| Woodie | 151.60 | 153.30 | 157.22 | 158.92 | 162.84 | 164.54 | 168.46 |
| Fibonacci | 152.93 | 155.08 | 156.40 | 158.55 | 160.70 | 162.02 | 164.17 |
| Pivot points | S3 | S2 | S1 | PP | R1 | R2 | R3 |
|---|---|---|---|---|---|---|---|
| Standard | 143.52 | 148.89 | 159.52 | 164.89 | 175.52 | 180.89 | 191.52 |
| Camarilla | 165.76 | 167.23 | 168.69 | 170.16 | 171.63 | 173.09 | 174.56 |
| Woodie | 146.16 | 150.21 | 162.16 | 166.21 | 178.16 | 182.21 | 194.16 |
| Fibonacci | 148.89 | 155.00 | 158.78 | 164.89 | 171.00 | 174.78 | 180.89 |
| Pivot points | S3 | S2 | S1 | PP | R1 | R2 | R3 |
|---|---|---|---|---|---|---|---|
| Standard | 95.21 | 124.73 | 142.99 | 172.51 | 190.77 | 220.29 | 238.55 |
| Camarilla | 148.11 | 152.49 | 156.87 | 161.25 | 165.63 | 170.01 | 174.39 |
| Woodie | 89.58 | 121.92 | 137.36 | 169.70 | 185.14 | 217.48 | 232.92 |
| Fibonacci | 124.73 | 142.98 | 154.26 | 172.51 | 190.76 | 202.04 | 220.29 |
Numerical data
The following is the status of technical indicators and moving averages registered at the time this technical analysis was created:
| RSI (14): | 27.85 | |
| MACD (12,26,9): | -30.1200 | |
| Directional Movement: | -25.16 | |
| AROON (14): | -78.57 | |
| DEMA (21): | 164.35 | |
| Parabolic SAR (0,02-0,02-0,2): | 220.26 | |
| Elder Ray (13): | -25.89 | |
| Super Trend (3,10): | 226.89 | |
| Zig ZAG (10): | 160.03 | |
| VORTEX (21): | 0.8300 | |
| Stochastique (14,3,5): | 10.53 | |
| TEMA (21): | 156.46 | |
| Williams %R (14): | -93.00 | |
| Chande Momentum Oscillator (20): | -62.30 | |
| Repulse (5,40,3): | -9.5900 | |
| ROCnROLL: | 2 | |
| TRIX (15,9): | -1.7400 | |
| Courbe Coppock: | 33.49 |
| MA7: | 163.47 | |
| MA20: | 170.80 | |
| MA50: | 185.55 | |
| MA100: | 198.86 | |
| MAexp7: | 176.09 | |
| MAexp20: | 204.90 | |
| MAexp50: | 247.60 | |
| MAexp100: | 258.84 | |
| Price / MA7: | -2.10% | |
| Price / MA20: | -6.31% | |
| Price / MA50: | -13.75% | |
| Price / MA100: | -19.53% | |
| Price / MAexp7: | -9.12% | |
| Price / MAexp20: | -21.90% | |
| Price / MAexp50: | -35.37% | |
| Price / MAexp100: | -38.17% |
News
The last news published on META PLATFORMS INC. at the time of the generation of this analysis was as follows:
- META PLATFORMS, INC. F/K/A FACEBOOK, INC. (NASDAQ: FB) SHAREHOLDER CLASS ACTION DEADLINE- Bernstein Liebhard LLP Reminds Investors of the Deadline to File a Lead Plaintiff Motion in a Securities Class Action Lawsuit Against Facebook, Inc.
- SHAREHOLDER ALERT: Levi & Korsinsky, LLP Notifies Shareholders of Meta Platforms, Inc. f.k.a. Facebook, Inc. of a Class Action Lawsuit and a Lead Plaintiff Deadline of December 27, 2021 - FB
- ROSEN, A LEADING AND RANKED FIRM, Encourages Meta Platforms, Inc. f/k/a Facebook, Inc. Investors with Losses in Excess of $1MM to Secure Counsel Before Important Deadline in Securities Class Action Commenced by the Firm - FB
- Levi & Korsinsky, LLP, Researching Possible Securities Law Violations - Meta Platforms, Inc. f.k.a. Facebook, Inc. - FB
- INVESTOR ACTION REMINDER: The Schall Law Firm Reminds Investors of a Class Action Lawsuit Against Meta Platforms, Inc. f/k/a Facebook, Inc. and Encourages Investors with Losses in Excess of $100,000 to Contact the Firm
About author

Online


Add a comment
Comments
0 comments on the analysis META PLATFORMS INC. - Weekly