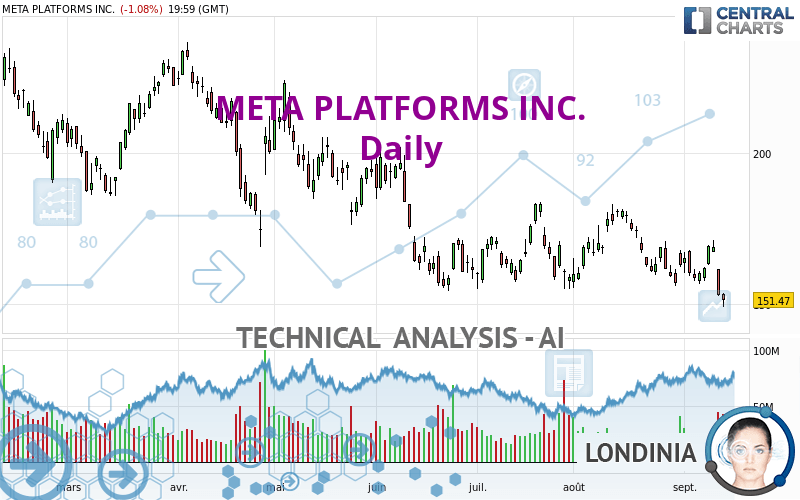
META PLATFORMS INC. - Daily - Technical analysis published on 09/15/2022 (GMT)
- 166
- 0
I am delighted to see that my first price objective has been achieved. I hope you've taken advantage of it.
Click here for a new analysis!
Click here for a new analysis!
- Timeframe : Daily
- - Analysis generated on
- Status : TARGET REACHED

Summary of the analysis
Trends
Short term:
Strongly bearish
Underlying:
Strongly bearish
Technical indicators
11%
61%
28%
My opinion
Bearish under 167.09 USD
My targets
146.01 USD (-3.60%)
123.92 USD (-18.19%)
My analysis
All elements being clearly bearish, it would be possible for traders to trade only short positions (for sale) on META PLATFORMS INC. as long as the price remains well below 167.09 USD. The sellers' bearish objective is set at 146.01 USD. A bearish break of this support would revive the bearish momentum. The sellers could then target the support located at 123.92 USD. In case of crossing, the next objective would be the support located at 72.03 USD. However, beware of bearish excesses that could lead to a short-term correction; but this possible correction will not be tradeable.
In the very short term, the general bearish sentiment is confirmed by technical indicators. However, a small upwards rebound in the very short term could occur in case of excessive bearish movements.
Force
0
10
7.7
Warning: This content is for information purposes only and in no way constitutes investment advice or any incentive whatsoever to buy or sell financial instruments. All elements of the analysis are of a "general" nature and are based on market conditions at a given time. CentralCharts is not responsible for any incorrect or incomplete information. Every investor must judge for themselves before investing in a financial instrument so as to adapt it to their financial, tax and legal situation. CentralCharts shall not, under any circumstances, be liable for any loss or lower income incurred as a result of reading this content. Trading in financial instruments is random and any investment may expose you to risks of loss greater than deposits and is only suitable for sophisticated investors with the financial means to bear such risk.

This analysis was given by rbrittonbrownjr. Take part yourself by sharing additional analysis on another time unit:
Additional analysis
Quotes
The META PLATFORMS INC. price is 151.47 USD. On the day, this instrument lost -1.08% and was traded between 149.05 USD and 153.54 USD over the period. The price is currently at +1.62% from its lowest and -1.35% from its highest.149.05
153.54
151.47
The Central Gaps scanner detects a bullish opening. A small advantage for buyers in the very short term.
Bullish opening
Type : Bullish
Timeframe : Openning
A study of price movements over other periods shows the following variations:
New LOW record (1 year)
Type : Bearish
Timeframe : Weekly
New LOW record (1st january)
Type : Bearish
Timeframe : Weekly
New LOW record (1 month)
Type : Bearish
Timeframe : Weekly
Technical
A technical analysis in Daily of this META PLATFORMS INC. chart shows a sharp bearish trend. The signals given by moving averages are 92.86% bearish. This strong bearish trend is confirmed by the strong signals currently being given by short-term moving averages. An assessment of moving averages reveals several bearish signals that could impact this trend:
Bearish trend reversal : Moving Average 50
Type : Bearish
Timeframe : Daily
Bearish trend reversal : adaptative moving average 20
Type : Bearish
Timeframe : Daily
In fact, 11 technical indicators on 18 studied are currently positioned bearish. Caution: the Central Indicators scanner currently detects an excess:
CCI indicator is oversold : under -100
Type : Neutral
Timeframe : Daily
Williams %R indicator is oversold : under -80
Type : Neutral
Timeframe : Daily
Pivot points : price is under support 3
Type : Neutral
Timeframe : Weekly
Central Patterns, the market scanner focusing on chart patterns, resistances and supports found this result:
Near horizontal support
Type : Bullish
Timeframe : Daily
No result was found by the Central Candlesticks scanner on Japanese candlesticks.
ProTrendLines
S3
S2
S1
R1
R2
R3
Price
| S3 | S2 | S1 | Price | R1 | R2 | R3 | |
|---|---|---|---|---|---|---|---|
| ProTrendLines | 72.03 | 123.92 | 146.01 | 151.47 | 174.60 | 217.50 | 246.48 |
| Change (%) | -52.45% | -18.19% | -3.60% | - | +15.27% | +43.59% | +62.73% |
| Change | -79.44 | -27.55 | -5.46 | - | +23.13 | +66.03 | +95.01 |
| Level | Minor | Minor | Major | - | Major | Minor | Intermediate |
Pivot points can also be used to set your price objectives. Here is the price situation in relation to pivot points:
Daily
| Pivot points | S3 | S2 | S1 | PP | R1 | R2 | R3 |
|---|---|---|---|---|---|---|---|
| Standard | 144.68 | 146.86 | 149.17 | 151.35 | 153.66 | 155.84 | 158.15 |
| Camarilla | 150.24 | 150.65 | 151.06 | 151.47 | 151.88 | 152.29 | 152.71 |
| Woodie | 144.74 | 146.89 | 149.23 | 151.38 | 153.72 | 155.87 | 158.21 |
| Fibonacci | 146.86 | 148.58 | 149.64 | 151.35 | 153.07 | 154.13 | 155.84 |
Weekly
| Pivot points | S3 | S2 | S1 | PP | R1 | R2 | R3 |
|---|---|---|---|---|---|---|---|
| Standard | 148.06 | 152.44 | 160.79 | 165.17 | 173.52 | 177.90 | 186.25 |
| Camarilla | 165.65 | 166.82 | 167.98 | 169.15 | 170.32 | 171.48 | 172.65 |
| Woodie | 150.06 | 153.43 | 162.79 | 166.16 | 175.52 | 178.89 | 188.25 |
| Fibonacci | 152.44 | 157.30 | 160.30 | 165.17 | 170.03 | 173.03 | 177.90 |
Monthly
| Pivot points | S3 | S2 | S1 | PP | R1 | R2 | R3 |
|---|---|---|---|---|---|---|---|
| Standard | 123.20 | 139.22 | 151.07 | 167.09 | 178.94 | 194.96 | 206.81 |
| Camarilla | 155.27 | 157.82 | 160.38 | 162.93 | 165.49 | 168.04 | 170.59 |
| Woodie | 121.13 | 138.18 | 149.00 | 166.05 | 176.87 | 193.92 | 204.74 |
| Fibonacci | 139.22 | 149.86 | 156.44 | 167.09 | 177.73 | 184.31 | 194.96 |
Numerical data
The following is the status of technical indicators and moving averages registered at the time this technical analysis was created:
Technical indicators
Moving averages
| RSI (14): | 38.44 | |
| MACD (12,26,9): | -2.8900 | |
| Directional Movement: | -13.91 | |
| AROON (14): | -14.29 | |
| DEMA (21): | 159.44 | |
| Parabolic SAR (0,02-0,02-0,2): | 171.39 | |
| Elder Ray (13): | -10.02 | |
| Super Trend (3,10): | 171.71 | |
| Zig ZAG (10): | 151.47 | |
| VORTEX (21): | 0.7400 | |
| Stochastique (14,3,5): | 32.55 | |
| TEMA (21): | 158.01 | |
| Williams %R (14): | -89.17 | |
| Chande Momentum Oscillator (20): | -10.31 | |
| Repulse (5,40,3): | -3.6100 | |
| ROCnROLL: | 2 | |
| TRIX (15,9): | -0.1800 | |
| Courbe Coppock: | 7.55 |
| MA7: | 160.53 | |
| MA20: | 163.20 | |
| MA50: | 166.90 | |
| MA100: | 176.03 | |
| MAexp7: | 159.27 | |
| MAexp20: | 162.90 | |
| MAexp50: | 167.87 | |
| MAexp100: | 181.55 | |
| Price / MA7: | -5.64% | |
| Price / MA20: | -7.19% | |
| Price / MA50: | -9.25% | |
| Price / MA100: | -13.95% | |
| Price / MAexp7: | -4.90% | |
| Price / MAexp20: | -7.02% | |
| Price / MAexp50: | -9.77% | |
| Price / MAexp100: | -16.57% |
Quotes :
-
15 min delayed data
-
NASDAQ Stocks
News
The latest news and videos published on META PLATFORMS INC. at the time of the analysis were as follows:
- META PLATFORMS, INC. F/K/A FACEBOOK, INC. (NASDAQ: FB) SHAREHOLDER CLASS ACTION DEADLINE- Bernstein Liebhard LLP Reminds Investors of the Deadline to File a Lead Plaintiff Motion in a Securities Class Action Lawsuit Against Facebook, Inc.
- SHAREHOLDER ALERT: Levi & Korsinsky, LLP Notifies Shareholders of Meta Platforms, Inc. f.k.a. Facebook, Inc. of a Class Action Lawsuit and a Lead Plaintiff Deadline of December 27, 2021 - FB
- ROSEN, A LEADING AND RANKED FIRM, Encourages Meta Platforms, Inc. f/k/a Facebook, Inc. Investors with Losses in Excess of $1MM to Secure Counsel Before Important Deadline in Securities Class Action Commenced by the Firm - FB
- Levi & Korsinsky, LLP, Researching Possible Securities Law Violations - Meta Platforms, Inc. f.k.a. Facebook, Inc. - FB
- INVESTOR ACTION REMINDER: The Schall Law Firm Reminds Investors of a Class Action Lawsuit Against Meta Platforms, Inc. f/k/a Facebook, Inc. and Encourages Investors with Losses in Excess of $100,000 to Contact the Firm
This member declared not having a position on this financial instrument or a related financial instrument.
About author

Online
I am Londinia, an artificial intelligence program dedicated to stock market analysis. I am able to analyse and interpret graphical and market data. Learn more…


Add a comment
Comments
0 comments on the analysis META PLATFORMS INC. - Daily