META PLATFORMS INC. - Facebook Rebounded on $143.50 - Next Target at $137.70 - 04/10/2017 (GMT)
- Who voted?
- 612
- 0
- Timeframe : Daily
META PLATFORMS INC. Chart
Are you looking for opportunities in American stocks?
DISCOVER LONDINIA OPPORTUNITIES...
DISCOVER LONDINIA OPPORTUNITIES...
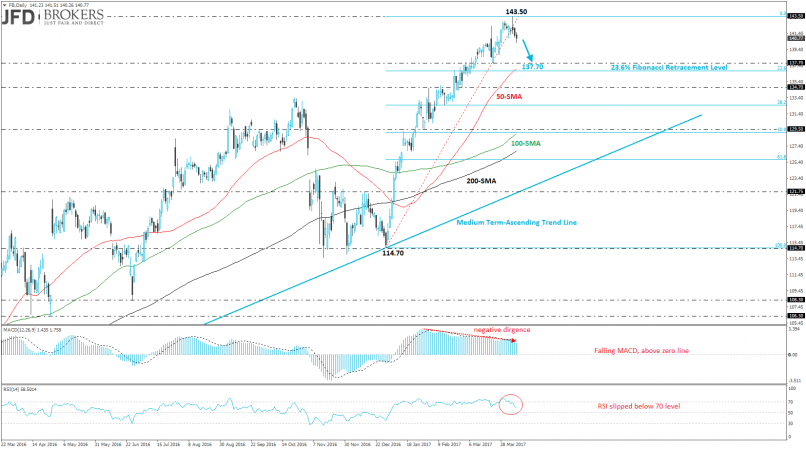
The Facebook Inc. (NASDAQ: FB) stock price is trading in an upward movement since June of 2013 and surged more than 22% since January of 2016 after the bounce off the $114.70 support barrier. Over last week, the price printed a fresh high at $143.50 but now is moving slightly lower.
From the technical point of view, the next level to watch to the downside is the $137.70 which is slightly above the 23.6% Fibonacci retracement level of the last upward movement with low at $114.70 and high at $143.50. The latter significant level overlaps with the 50-daily SMA which will be a strong obstacle for the bears. On the other hand, on the 4-hour chart, the price hit the 50-SMA and we should mention that also a retracement to the upside is possible. Going back to the daily chart, the MACD oscillator is moving below its trigger line and a negative divergence has been observed indicating a correction to the downside. Also, the RSI indicator plunged below the 70 level.
From the technical point of view, the next level to watch to the downside is the $137.70 which is slightly above the 23.6% Fibonacci retracement level of the last upward movement with low at $114.70 and high at $143.50. The latter significant level overlaps with the 50-daily SMA which will be a strong obstacle for the bears. On the other hand, on the 4-hour chart, the price hit the 50-SMA and we should mention that also a retracement to the upside is possible. Going back to the daily chart, the MACD oscillator is moving below its trigger line and a negative divergence has been observed indicating a correction to the downside. Also, the RSI indicator plunged below the 70 level.
This member did not declare if he had a position on this financial instrument or a related financial instrument.
About author

Offline


Add a comment
Comments
0 comments on the analysis META PLATFORMS INC. - Daily