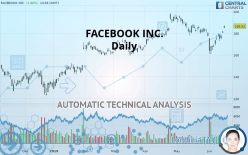
META PLATFORMS INC. - Daily - Technical analysis published on 06/17/2019 (GMT)
- Who voted?
- 193
- 0
Click here for a new analysis!
- Timeframe : Daily
- - Analysis generated on
- Status : TARGET REACHED

Summary of the analysis

Additional analysis
Quotes
The FACEBOOK INC. rating is 186.53 USD. On the day, this instrument gained +2.87% and was traded between 184.41 USD and 186.95 USD over the period. The price is currently at +1.15% from its lowest and -0.22% from its highest.The Central Gaps scanner detects the formation of a bullish gap marking the strong presence of buyers against sellers at the opening. This formed a quotation gap.
Opening Gap UP
Type : Bullish
Timeframe : Openning
Here is a more detailed summary of the historical variations registered by FACEBOOK INC.:
Near a new HIGH record (1 month)
Type : Bullish
Timeframe : Weekly
Technical
A technical analysis in Daily of this FACEBOOK INC. chart shows a strongly bullish trend. The signals given by moving averages are 85.71% bullish. This strongly bullish trend seems to be running out of steam given the signals being given by short-term moving averages. The Central Indicators scanner detects bullish signals on moving averages that could impact this trend:
Bullish trend reversal : adaptative moving average 50
Type : Bullish
Timeframe : Daily
Bullish price crossover with Moving Average 20
Type : Bullish
Timeframe : Daily
Bullish price crossover with adaptative moving average 20
Type : Bullish
Timeframe : Daily
Bullish price crossover with adaptative moving average 50
Type : Bullish
Timeframe : Daily
In fact, according to the parameters integrated into the Central Analyzer system, 13 technical indicators out of 18 analysed are currently bullish. But beware of excesses. The Central Indicators scanner currently detects this:
Williams %R indicator is overbought : over -20
Type : Neutral
Timeframe : Daily
Pivot points : price is over resistance 1
Type : Neutral
Timeframe : Weekly
Pivot points : price is over resistance 3
Type : Neutral
Timeframe : Daily
RSI indicator is back over 50
Type : Bullish
Timeframe : Daily
SuperTrend indicator bullish reversal
Type : Bullish
Timeframe : Daily
An analysis of the price chart with the Central Patterns scanner (detector of chart patterns and resistances and supports) shows a result that can have an impact on the price change:
Near horizontal support
Type : Bullish
Timeframe : Daily
For a small rebound in the very short term, the Central Candlesticks scanner currently notes the presence of this bullish pattern in Japanese candlesticks:
Upside gap
Type : Bullish
Timeframe : Daily
| S3 | S2 | S1 | Price | R1 | R2 | |
|---|---|---|---|---|---|---|
| ProTrendLines | 160.27 | 171.32 | 180.76 | 186.53 | 193.09 | 217.50 |
| Change (%) | -14.08% | -8.15% | -3.09% | - | +3.52% | +16.60% |
| Change | -26.26 | -15.21 | -5.77 | - | +6.56 | +30.97 |
| Level | Major | Intermediate | Intermediate | - | Major | Intermediate |
Attention could also be paid to pivot points to set price objectives:
| Pivot points | S3 | S2 | S1 | PP | R1 | R2 | R3 |
|---|---|---|---|---|---|---|---|
| Standard | 178.43 | 179.22 | 180.27 | 181.06 | 182.11 | 182.90 | 183.95 |
| Camarilla | 180.82 | 180.99 | 181.16 | 181.33 | 181.50 | 181.67 | 181.84 |
| Woodie | 178.57 | 179.29 | 180.41 | 181.12 | 182.25 | 182.96 | 184.09 |
| Fibonacci | 179.22 | 179.92 | 180.35 | 181.06 | 181.76 | 182.19 | 182.90 |
| Pivot points | S3 | S2 | S1 | PP | R1 | R2 | R3 |
|---|---|---|---|---|---|---|---|
| Standard | 166.57 | 169.72 | 175.53 | 178.68 | 184.49 | 187.64 | 193.45 |
| Camarilla | 178.87 | 179.69 | 180.51 | 181.33 | 182.15 | 182.97 | 183.79 |
| Woodie | 167.89 | 170.38 | 176.85 | 179.35 | 185.81 | 188.30 | 194.77 |
| Fibonacci | 169.72 | 173.15 | 175.26 | 178.68 | 182.11 | 184.22 | 187.64 |
Numerical data
The following is the status of technical indicators and moving averages registered at the time this technical analysis was created:
| RSI (14): | 59.02 | |
| MACD (12,26,9): | -0.8800 | |
| Directional Movement: | 3.47 | |
| AROON (14): | 64.29 | |
| DEMA (21): | 177.01 | |
| Parabolic SAR (0,02-0,02-0,2): | 162.76 | |
| Elder Ray (13): | 7.395 | |
| Super Trend (3,10): | 170.44 | |
| Zig ZAG (10): | 186.14 | |
| VORTEX (21): | 0.8700 | |
| Stochastique (14,3,5): | 85.17 | |
| TEMA (21): | 176.32 | |
| Williams %R (14): | -0.41 | |
| Chande Momentum Oscillator (20): | 3.68 | |
| Repulse (5,40,3): | 1.9300 | |
| ROCnROLL: | 1 | |
| TRIX (15,9): | -0.1900 | |
| Courbe Coppock: | 5.13 |
| MA7: | 177.90 | |
| MA20: | 177.76 | |
| MA50: | 182.13 | |
| MA100: | 173.50 | |
| MAexp7: | 178.86 | |
| MAexp20: | 178.47 | |
| MAexp50: | 178.30 | |
| MAexp100: | 173.67 | |
| Price / MA7: | +4.85% | |
| Price / MA20: | +4.93% | |
| Price / MA50: | +2.42% | |
| Price / MA100: | +7.51% | |
| Price / MAexp7: | +4.29% | |
| Price / MAexp20: | +4.52% | |
| Price / MAexp50: | +4.62% | |
| Price / MAexp100: | +7.40% |
News
The latest news and videos published on FACEBOOK INC. at the time of the analysis were as follows:
-
 Facebook to introduce its own cryptocurrency
- FB ALERT: Hagens Berman Alerts Facebook, Inc. (FB) Shareholders to Privacy Compliance Email Investigation, Long-Term FB Shareholders May Contact Firm
-
Facebook Shares Drop After Report Uncovers Zuckerberg Emails
-
Zuckerberg values profits over privacy: Tech expert
-
Mark Zuckerberg's Old Emails Might Complicate The FTC Privacy Probe
About author

Online


Add a comment
Comments
0 comments on the analysis META PLATFORMS INC. - Daily