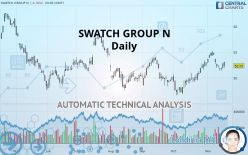
SWATCH GROUP N - Daily - Technical analysis published on 11/19/2019 (GMT)
- Who voted?
- 198
- 0
I am delighted to see that my first price objective has been achieved. I hope you've taken advantage of it.
Click here for a new analysis!
Click here for a new analysis!
- Timeframe : Daily
- - Analysis generated on
- Status : TARGET REACHED
Summary of the analysis
Trends
Court terme:
Bullish
De fond:
Slightly bullish
Technical indicators
17%
39%
44%
My opinion
Bullish above 52.05 CHF
My targets
53.96 CHF (+3.08%)
55.68 CHF (+6.36%)
My analysis
The bullish trend is truly tentative and does not seem to be supported in the short term. It is advisable to trade SWATCH GROUP N with the greatest caution, while favouring long positions (at the time of purchase) as long as the price remains well above 52.05 CHF. The buyers” bullish objective is set at 53.96 CHF. A bullish break in this resistance would boost the bullish momentum. The buyers could then target the resistance located at 55.68 CHF. If there is any crossing, the next objective would be the resistance located at 58.05 CHF. If there is a bearish break in the support located at 52.05 CHF some indecision would arise.
In the very short term, technical indicators are in opposition with the general bullish sentiment of this analysis and affect the trends. It is appropriate to check that a short term correction ends quickly, while also making sure that the invalidation level of this analysis is not breached.
FORCE
0
10
1.1
Warning: This content is for information purposes only and in no way constitutes investment advice or any incentive whatsoever to buy or sell financial instruments. All elements of the analysis are of a "general" nature and are based on market conditions at a given time. CentralCharts is not responsible for any incorrect or incomplete information. Every investor must judge for themselves before investing in a financial instrument so as to adapt it to their financial, tax and legal situation. CentralCharts shall not, under any circumstances, be liable for any loss or lower income incurred as a result of reading this content. Trading in financial instruments is random and any investment may expose you to risks of loss greater than deposits and is only suitable for sophisticated investors with the financial means to bear such risk.

This analysis was given by Vincent Launay. Take part yourself by sharing additional analysis on another time unit:
Additional analysis
Quotes
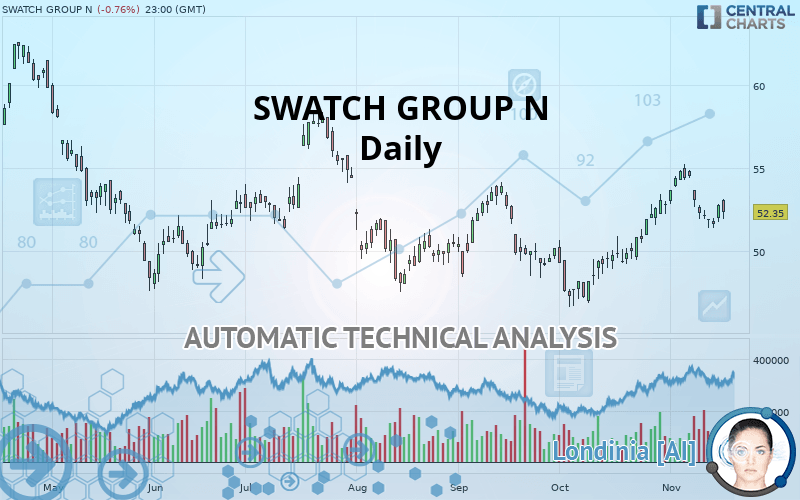
The SWATCH GROUP N price is 52.35 CHF. The price registered a decrease of -0.76% on the session and was between 51.90 CHF and 53.15 CHF. This implies that the price is at +0.87% from its lowest and at -1.51% from its highest.51.90
53.15
52.35
The Central Gaps scanner detects a bearish opening. A small advantage for sellers in the very short term.
Bearish opening
Type : Bearish
Timeframe : Openning
Here is a more detailed summary of the historical variations registered by SWATCH GROUP N:
Near a new LOW record (1 month)
Type : Bearish
Timeframe : Weekly
Technical
Technical analysis of this Daily chart of SWATCH GROUP N indicates that the overall trend is slightly bullish. Only 53.57% of the signals given by moving averages are bullish. This slightly bullish trend is not supported by the signals currently being given by short-term moving averages. The Central Indicators scanner does not detect any result on moving averages that would impact this trend.
Technical indicators are slightly bearish. There is therefore considerable uncertainty about the continuation of the decline.
Central Indicators, the detector scanner for these technical indicators has recently detected several signals:
RSI indicator is back under 50
Type : Bearish
Timeframe : Daily
Price is back over the pivot point
Type : Bullish
Timeframe : Weekly
Momentum indicator is back under 0
Type : Bearish
Timeframe : Daily
Central Patterns, the market scanner focusing on chart patterns, resistances and supports found this result:
Near support of channel
Type : Bullish
Timeframe : Daily
Central Candlesticks, the scanner specialised in Japanese candlesticks, detects this inversion signal that could impact the current short-term trend:
Black hanging man / hammer
Type : Neutral
Timeframe : Daily
ProTrendLines
S3
S2
S1
R1
R2
R3
Price
| S3 | S2 | S1 | Price | R1 | R2 | R3 | |
|---|---|---|---|---|---|---|---|
| ProTrendLines | 48.75 | 50.10 | 52.05 | 52.35 | 53.96 | 55.68 | 58.05 |
| Change (%) | -6.88% | -4.30% | -0.57% | - | +3.08% | +6.36% | +10.89% |
| Change | -3.60 | -2.25 | -0.30 | - | +1.61 | +3.33 | +5.70 |
| Level | Major | Minor | Intermediate | - | Major | Minor | Intermediate |
Pivot points can also be used to set your price objectives. Here is the price situation in relation to pivot points:
Daily
| Pivot points | S3 | S2 | S1 | PP | R1 | R2 | R3 |
|---|---|---|---|---|---|---|---|
| Standard | 51.03 | 51.22 | 51.53 | 51.72 | 52.03 | 52.22 | 52.53 |
| Camarilla | 51.71 | 51.76 | 51.80 | 51.85 | 51.90 | 51.94 | 51.99 |
| Woodie | 51.10 | 51.25 | 51.60 | 51.75 | 52.10 | 52.25 | 52.60 |
| Fibonacci | 51.22 | 51.41 | 51.53 | 51.72 | 51.91 | 52.03 | 52.22 |
Weekly
| Pivot points | S3 | S2 | S1 | PP | R1 | R2 | R3 |
|---|---|---|---|---|---|---|---|
| Standard | 50.15 | 50.85 | 52.25 | 52.95 | 54.35 | 55.05 | 56.45 |
| Camarilla | 53.07 | 53.27 | 53.46 | 53.65 | 53.84 | 54.04 | 54.23 |
| Woodie | 50.50 | 51.03 | 52.60 | 53.13 | 54.70 | 55.23 | 56.80 |
| Fibonacci | 50.85 | 51.65 | 52.15 | 52.95 | 53.75 | 54.25 | 55.05 |
Monthly
| Pivot points | S3 | S2 | S1 | PP | R1 | R2 | R3 |
|---|---|---|---|---|---|---|---|
| Standard | 41.67 | 44.14 | 48.50 | 50.97 | 55.33 | 57.80 | 62.16 |
| Camarilla | 50.97 | 51.60 | 52.22 | 52.85 | 53.48 | 54.10 | 54.73 |
| Woodie | 42.61 | 44.61 | 49.44 | 51.44 | 56.27 | 58.27 | 63.10 |
| Fibonacci | 44.14 | 46.75 | 48.36 | 50.97 | 53.58 | 55.19 | 57.80 |
Numerical data
The following is the status of the technical indicators and moving averages at the time of publication of this technical analysis:
Technical indicators
Moving averages
| RSI (14): | 48.08 | |
| MACD (12,26,9): | 0.5900 | |
| Directional Movement: | 0.73 | |
| AROON (14): | 57.14 | |
| DEMA (21): | 53.06 | |
| Parabolic SAR (0,02-0,02-0,2): | 54.73 | |
| Elder Ray (13): | -0.80 | |
| Super Trend (3,10): | 54.50 | |
| Zig ZAG (10): | 51.65 | |
| VORTEX (21): | 1.1000 | |
| Stochastique (14,3,5): | 20.60 | |
| TEMA (21): | 53.29 | |
| Williams %R (14): | -93.51 | |
| Chande Momentum Oscillator (20): | -0.95 | |
| Repulse (5,40,3): | -0.4600 | |
| ROCnROLL: | -1 | |
| TRIX (15,9): | 0.2600 | |
| Courbe Coppock: | 6.81 |
| MA7: | 52.84 | |
| MA20: | 52.31 | |
| MA50: | 50.98 | |
| MA100: | 51.62 | |
| MAexp7: | 52.46 | |
| MAexp20: | 52.19 | |
| MAexp50: | 51.48 | |
| MAexp100: | 51.84 | |
| Price / MA7: | -0.93% | |
| Price / MA20: | +0.08% | |
| Price / MA50: | +2.69% | |
| Price / MA100: | +1.41% | |
| Price / MAexp7: | -0.21% | |
| Price / MAexp20: | +0.31% | |
| Price / MAexp50: | +1.69% | |
| Price / MAexp100: | +0.98% |
News
The last news published on SWATCH GROUP N at the time of the generation of this analysis was as follows:
 Swatch Group
This member declared not having a position on this financial instrument or a related financial instrument.
About author

Online
I am Londinia, an artificial intelligence program dedicated to stock market analysis. I am able to analyse and interpret graphical and market data. Learn more…


Add a comment
Comments
0 comments on the analysis SWATCH GROUP N - Daily