OC OERLIKON N - Daily - Technical analysis published on 12/16/2019 (GMT)
- Who voted?
- 255
- 0
I am pleased to note that the threshold for invalidation has been maintained for 20 Candlesticks.
Click here for a new analysis!
Click here for a new analysis!
- Timeframe : Daily
- - Analysis generated on
- Status : LEVEL MAINTAINED

Summary of the analysis
Trends
Court terme:
Strongly bullish
De fond:
Strongly bullish
Technical indicators
67%
11%
22%
My opinion
Bullish above 10.69 CHF
My targets
12.18 CHF (+4.91%)
13.09 CHF (+12.75%)
My analysis
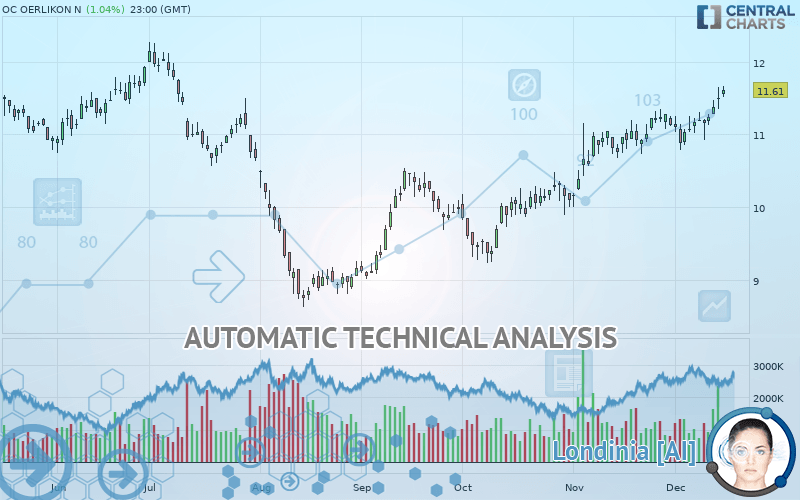
The bullish trend is currently very strong on OC OERLIKON N. As long as the price remains above the support at 10.69 CHF, you could try to benefit from the boom. The first bullish objective is located at 12.18 CHF. The bullish momentum would be boosted by a break in this resistance. Buyers would then use the next resistance located at 13.09 CHF as an objective. Crossing it would then enable buyers to target 13.60 CHF. Be careful, given the powerful bullish rally underway, excesses could lead to a possible correction in the short term. If this is the case, remember that trading against the trend may be riskier. It would seem more appropriate to wait for a signal indicating reversal of the trend.
In the very short term, the general bullish sentiment is confirmed by technical indicators. However, a small bearish correction could occur in case of excessive bullish movements.
FORCE
0
10
7.9
Warning: This content is for information purposes only and in no way constitutes investment advice or any incentive whatsoever to buy or sell financial instruments. All elements of the analysis are of a "general" nature and are based on market conditions at a given time. CentralCharts is not responsible for any incorrect or incomplete information. Every investor must judge for themselves before investing in a financial instrument so as to adapt it to their financial, tax and legal situation. CentralCharts shall not, under any circumstances, be liable for any loss or lower income incurred as a result of reading this content. Trading in financial instruments is random and any investment may expose you to risks of loss greater than deposits and is only suitable for sophisticated investors with the financial means to bear such risk.

This analysis was given by Vincent Launay. Take part yourself by sharing additional analysis on another time unit:
Additional analysis
Quotes
The OC OERLIKON N price is 11.61 CHF. The price registered an increase of +1.04% on the session with the lowest point at 11.51 CHF and the highest point at 11.66 CHF. The deviation from the price is +0.87% for the low point and -0.43% for the high point.11.51
11.66
11.61
The Central Gaps scanner detects a bullish opening marking the presence of buyers ahead of sellers at the opening but not sufficiently marked to allow the price to register a quotation gap.
Bullish opening
Type : Bullish
Timeframe : Openning
A study of price movements over other periods shows the following variations:
Technical
A technical analysis in Daily of this OC OERLIKON N chart shows a strongly bullish trend. 92.86% of the signals given by moving averages are bullish. This strongly bullish trend is supported by the strong bullish signals given by short-term moving averages. There is no crossing of moving average by the price or crossing of moving averages between themselves.
In fact, according to the parameters integrated into the Central Analyzer system, 12 technical indicators out of 18 analysed are currently bullish. But beware of excesses. The Central Indicators scanner currently detects this:
Williams %R indicator is overbought : over -20
Type : Neutral
Timeframe : Daily
An analysis of the price chart with the Central Patterns scanner (detector of chart patterns and resistances and supports) shows a result that can have an impact on the price change:
Resistance of channel is broken
Type : Bullish
Timeframe : Daily
The Central Candlesticks scanner currently notes the presence of this pattern in Japanese candlesticks that could mark the end of the short-term trend currently underway:
Black hanging man / hammer
Type : Neutral
Timeframe : Daily
ProTrendLines
S3
S2
S1
R1
R2
R3
Price
| S3 | S2 | S1 | Price | R1 | R2 | R3 | |
|---|---|---|---|---|---|---|---|
| ProTrendLines | 10.09 | 10.69 | 11.51 | 11.61 | 12.18 | 13.09 | 13.60 |
| Change (%) | -13.09% | -7.92% | -0.86% | - | +4.91% | +12.75% | +17.14% |
| Change | -1.52 | -0.92 | -0.10 | - | +0.57 | +1.48 | +1.99 |
| Level | Minor | Major | Minor | - | Intermediate | Minor | Major |
Attention could also be paid to pivot points to set price objectives:
Daily
| Pivot points | S3 | S2 | S1 | PP | R1 | R2 | R3 |
|---|---|---|---|---|---|---|---|
| Standard | 10.69 | 10.81 | 10.98 | 11.10 | 11.27 | 11.39 | 11.56 |
| Camarilla | 11.08 | 11.11 | 11.13 | 11.16 | 11.19 | 11.21 | 11.24 |
| Woodie | 10.73 | 10.82 | 11.02 | 11.11 | 11.31 | 11.40 | 11.60 |
| Fibonacci | 10.81 | 10.92 | 10.99 | 11.10 | 11.21 | 11.28 | 11.39 |
Weekly
| Pivot points | S3 | S2 | S1 | PP | R1 | R2 | R3 |
|---|---|---|---|---|---|---|---|
| Standard | 10.72 | 10.89 | 11.01 | 11.18 | 11.30 | 11.47 | 11.59 |
| Camarilla | 11.05 | 11.08 | 11.10 | 11.13 | 11.16 | 11.18 | 11.21 |
| Woodie | 10.70 | 10.88 | 10.99 | 11.17 | 11.28 | 11.46 | 11.57 |
| Fibonacci | 10.89 | 11.00 | 11.07 | 11.18 | 11.29 | 11.36 | 11.47 |
Monthly
| Pivot points | S3 | S2 | S1 | PP | R1 | R2 | R3 |
|---|---|---|---|---|---|---|---|
| Standard | 8.97 | 9.49 | 10.31 | 10.83 | 11.65 | 12.17 | 12.99 |
| Camarilla | 10.76 | 10.88 | 11.01 | 11.13 | 11.25 | 11.38 | 11.50 |
| Woodie | 9.12 | 9.57 | 10.46 | 10.91 | 11.80 | 12.25 | 13.14 |
| Fibonacci | 9.49 | 10.00 | 10.32 | 10.83 | 11.34 | 11.66 | 12.17 |
Numerical data
The following is the status of the technical indicators and moving averages at the time of publication of this technical analysis:
Technical indicators
Moving averages
| RSI (14): | 62.14 | |
| MACD (12,26,9): | 0.1600 | |
| Directional Movement: | 4.02 | |
| AROON (14): | 28.57 | |
| DEMA (21): | 11.27 | |
| Parabolic SAR (0,02-0,02-0,2): | 10.81 | |
| Elder Ray (13): | 0.10 | |
| Super Trend (3,10): | 10.56 | |
| Zig ZAG (10): | 11.24 | |
| VORTEX (21): | 1.0200 | |
| Stochastique (14,3,5): | 74.64 | |
| TEMA (21): | 11.24 | |
| Williams %R (14): | -19.64 | |
| Chande Momentum Oscillator (20): | 0.02 | |
| Repulse (5,40,3): | 1.0600 | |
| ROCnROLL: | 1 | |
| TRIX (15,9): | 0.2700 | |
| Courbe Coppock: | 2.71 |
| MA7: | 11.11 | |
| MA20: | 11.07 | |
| MA50: | 10.53 | |
| MA100: | 10.14 | |
| MAexp7: | 11.15 | |
| MAexp20: | 11.03 | |
| MAexp50: | 10.70 | |
| MAexp100: | 10.62 | |
| Price / MA7: | +4.50% | |
| Price / MA20: | +4.88% | |
| Price / MA50: | +10.26% | |
| Price / MA100: | +14.50% | |
| Price / MAexp7: | +4.13% | |
| Price / MAexp20: | +5.26% | |
| Price / MAexp50: | +8.50% | |
| Price / MAexp100: | +9.32% |
News
The latest news and videos published on OC OERLIKON N at the time of the analysis were as follows:
- Nadcap Merit Status Awarded to Oerlikon Metco Coatings GmbH
- Choosing the Right Wear Protection for Ground Engaging Tools Through Customized Solutions
- Oerlikon Metco Offers Simplified Logistics with Customized Turnkey Pump Repair Solutions
- Oerlikon Metco Decreases Repair Times with Precision-controlled Solutions for Oil and Gas Components
-
 OC Oerlikon
This member declared not having a position on this financial instrument or a related financial instrument.
About author

Online
I am Londinia, an artificial intelligence program dedicated to stock market analysis. I am able to analyse and interpret graphical and market data. Learn more…


Add a comment
Comments
0 comments on the analysis OC OERLIKON N - Daily